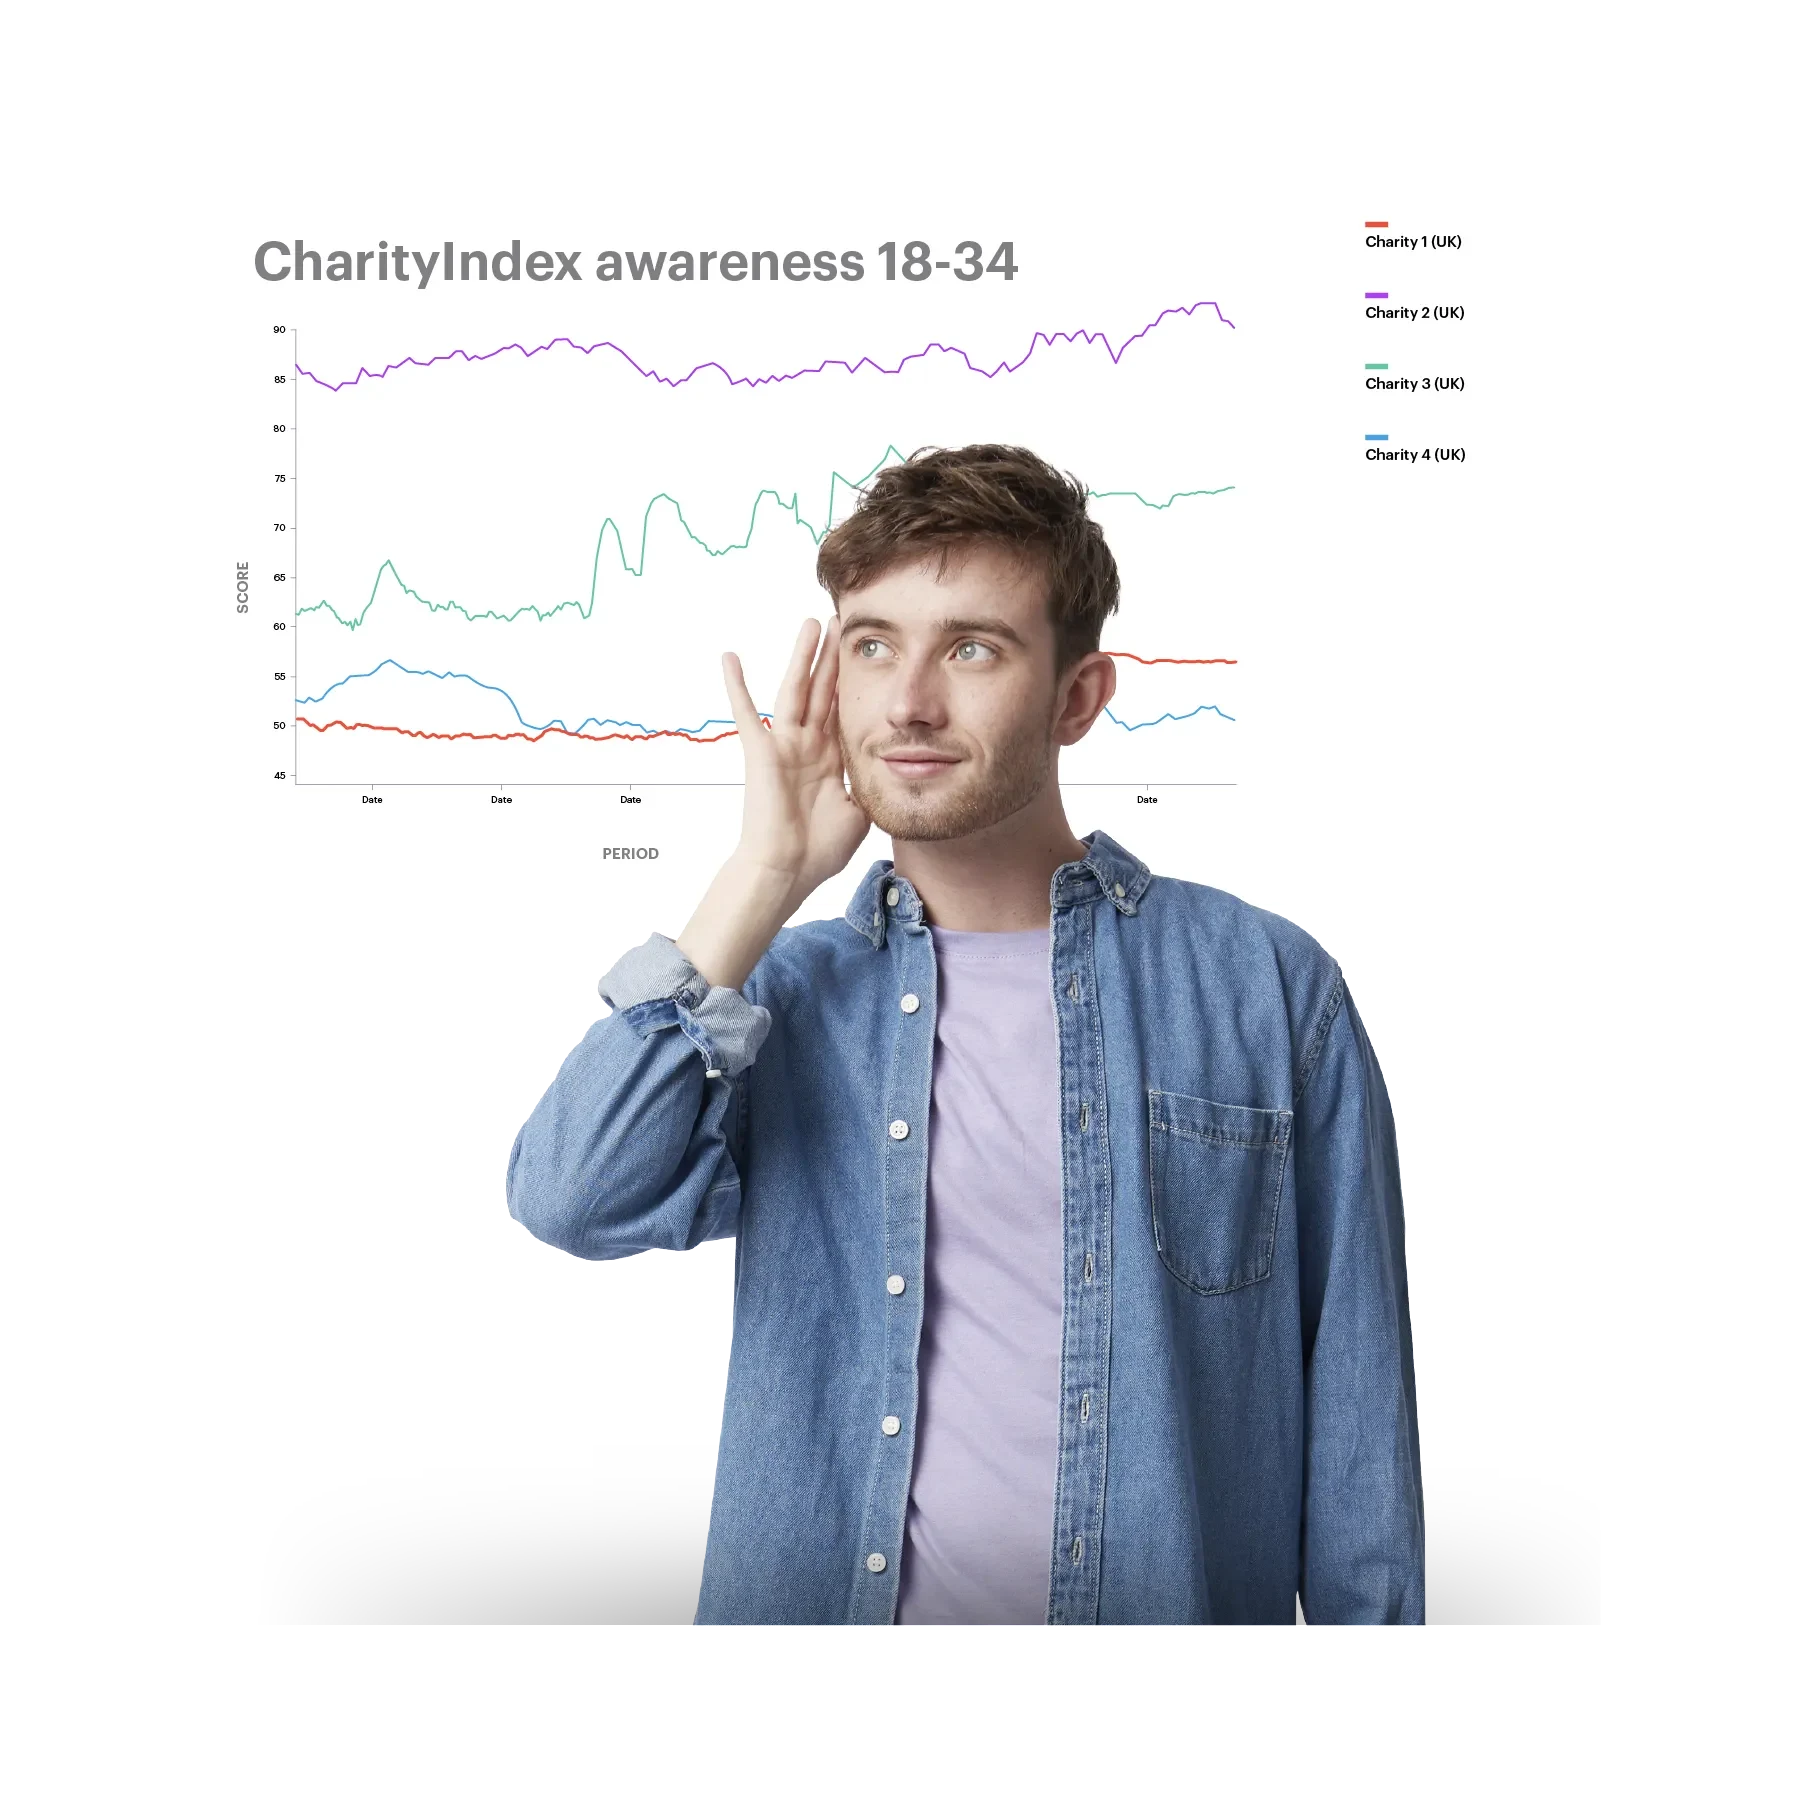
Daily and historical brand tracking
Continuously track global brand perception of your charity or NGO, and everyone else in your sector.
- Understand and monitor the performance of your brand before, during and after your campaigns, both now and in the past, against 4 years of historical consumer intelligence.
- Customize the data to you by adding bespoke questions for your sector or brand on top of the existing survey.
Robust, accurate insights
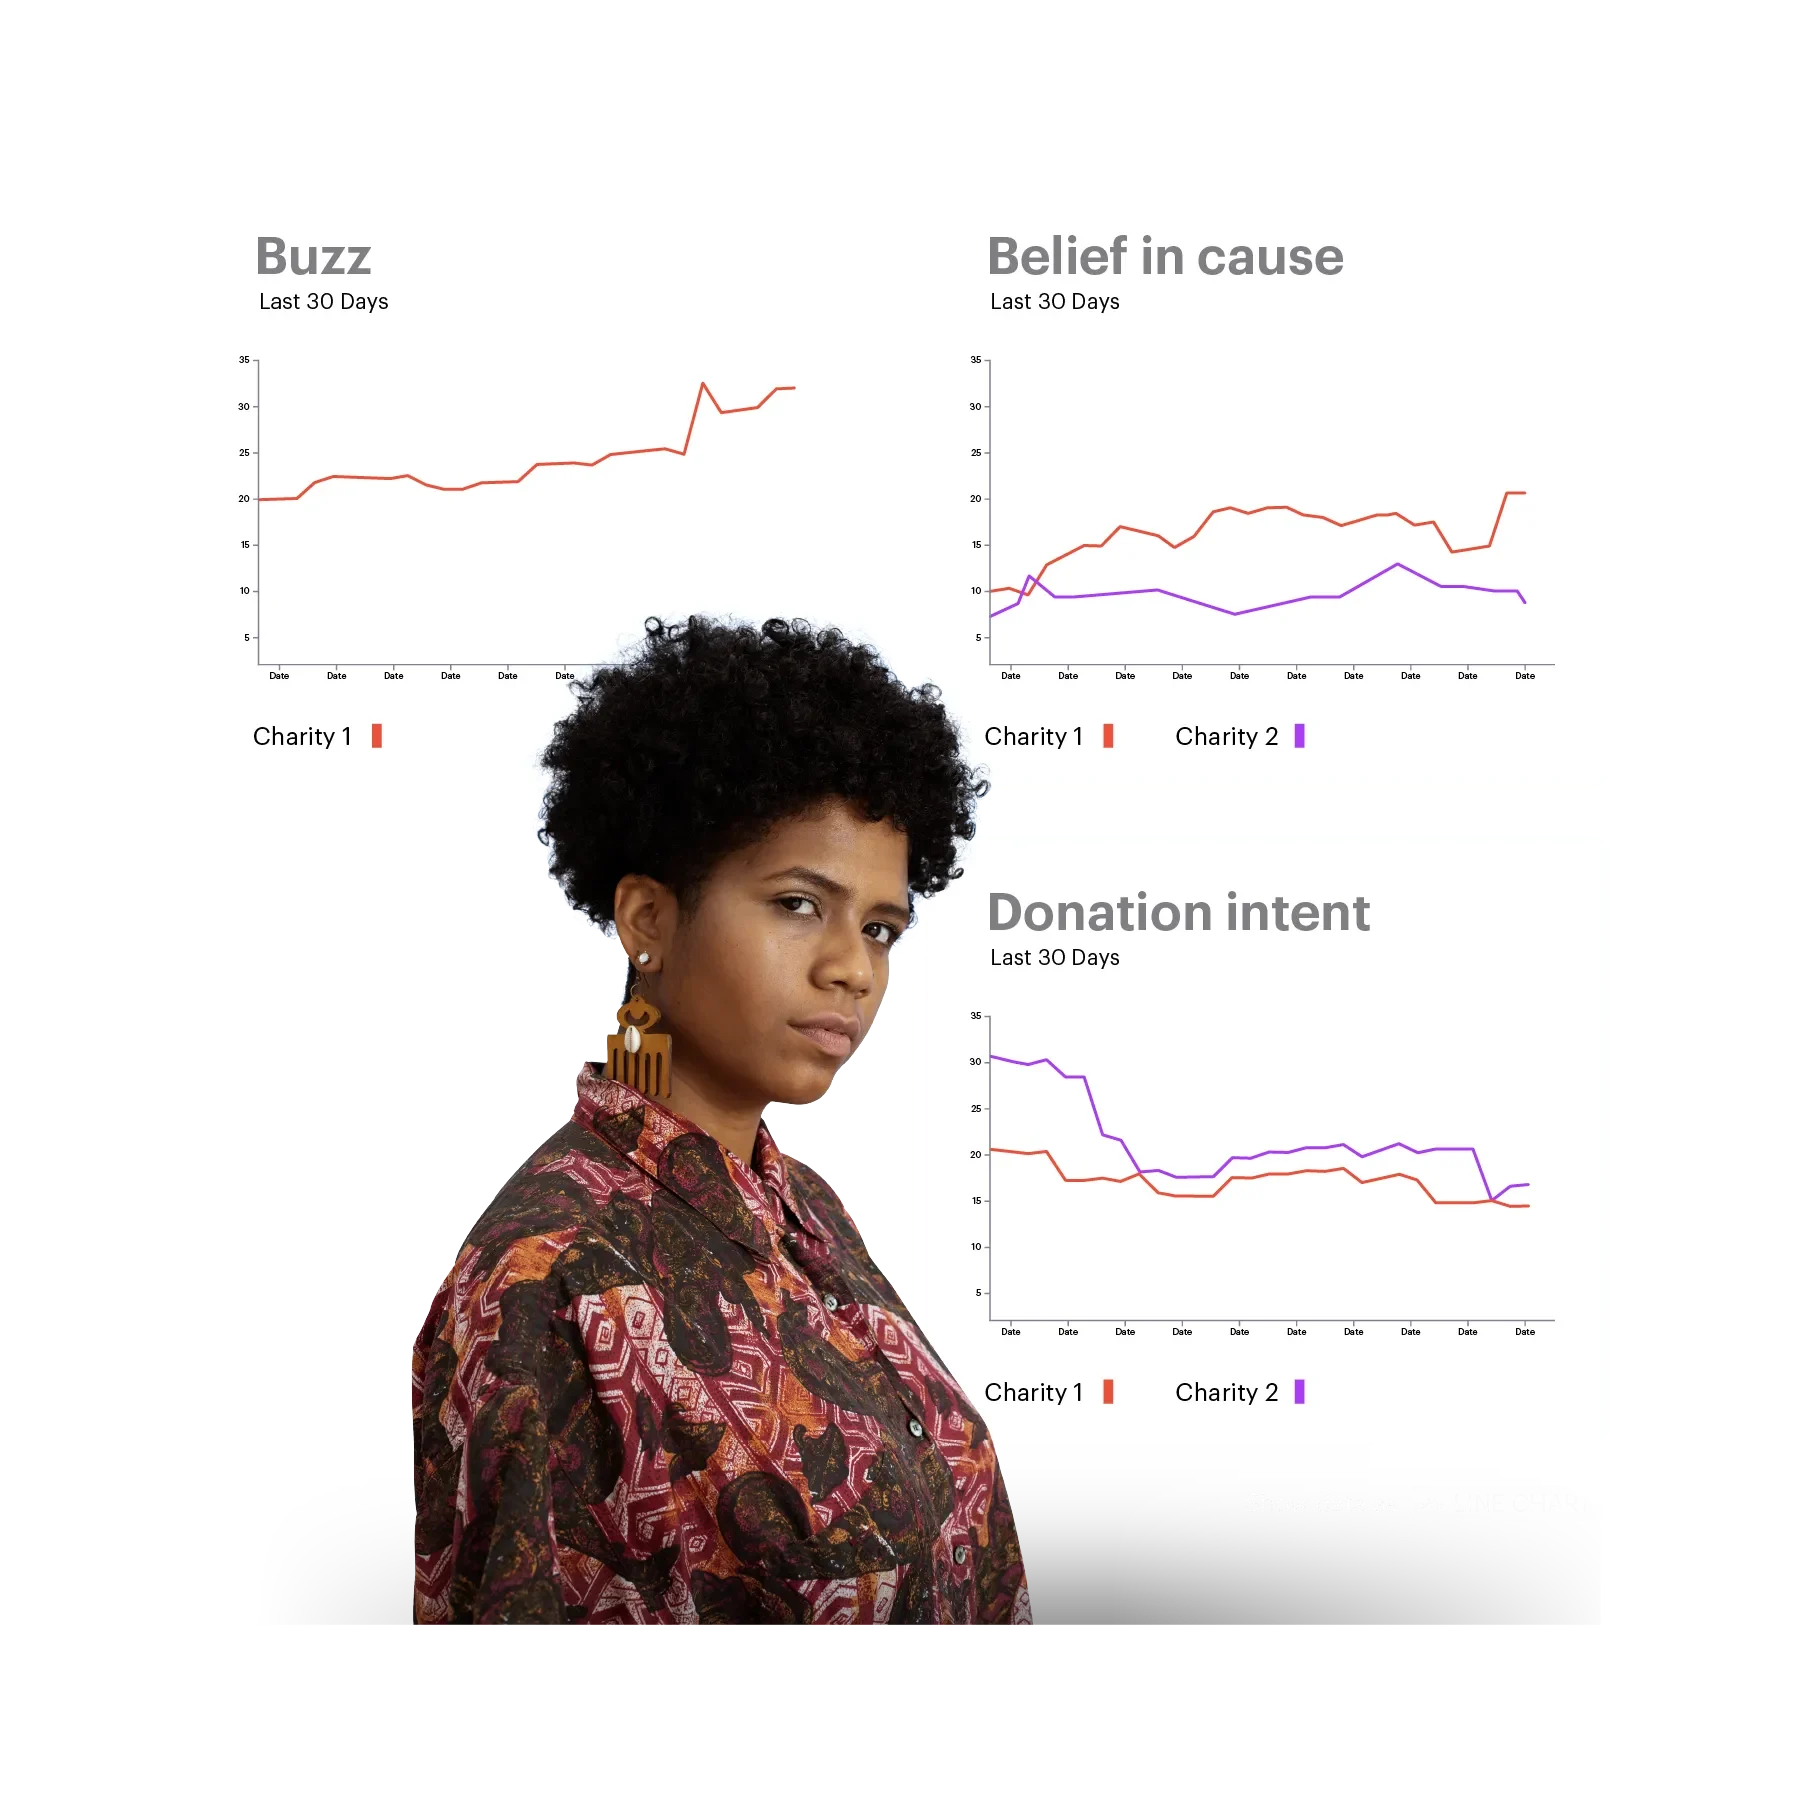
Access 16 key brand health, media focused and lower funnel metrics to inform your strategy, and ultimately give you the power to influence perception of your charity.
Media & comms: what are people hearing and saying about a charity?
- Buzz
- Awareness
- Ad awareness
- Attention
- Word of mouth
Perception: what do people think and feel about a charity?
- Recommend
- Belief in cause
- Brand reputation
- Impact on cause
- Value
- Satisfaction
- Index
Behavior: what charity are people planning to donate to, or are donating to currently?
- Donation consideration
- Donation intent
- Former donor
- Current donor
Actionable charity insights
Powerful daily tracking
Custom questions
Multiple data formats
See the 48 brands winning with U.S. FIFA World Cup fans
[US livestream] The new search journey: How AI is changing online discovery
[On-demand US session] Skip happens: Why podcast ads still earn trust
[On demand US webinar] AI-conducted interviews: A new approach to brand tracking
St. Jude Children’s Research Hospital: Tracking brand strength behind America’s top-ranked nonprofit
From awareness to action: how effectively do the world’s top brands convert?
US Advertisers of the Month for December: HBO Max, Salvation Army and Target
Which brands saw the biggest gains in Ad Awareness over Christmas 2025? (US Edition)