An experimental approach to forecasting the House of Representatives
By now, even the most casual of observers will have noticed that the presidential race has tightened, and that it is currently looking like it will be a close election. By contrast, the 435 House races that will also be decided on November 8th have received less attention. There has been some speculation that if Donald Trump performs poorly in the presidential election, this may depress Republican turnout in down-ballot races and give the Democrats a chance at taking back the House.
The methodology that we use in our analysis of the presidential election can also be used to estimate voter opinion on other issues, including vote intention for House races. Here, rather than drawing from a question that asks respondents which presidential candidate they will vote for on November 8th, we ask “Who did/will you vote for in the election for U.S. House of Representatives in your area?” with generic response options for the Democratic or Republican Party candidate. We then run this through the same machinery that we use to produce the presidential forecasts.
Our House estimates should be considered “experimental”. This is an initial attempt at applying this methodology to House election prediction, and we have not been able to test it on past House election because of limitations in our archive of data. We also made some design decisions in the model that were focused on the presidential election, rather than optimizing for the House. But even given this caveat, we think that these House forecasts provide reasonable expectations for what will happen on Tuesday.
First, we currently estimate that the Democrats have a national vote lead of 1.9% in House races (based on data up to November 3rd). This contrasts the 2.4% national vote lead that we currently estimate for Hilary Clinton in the presidential race at the same point. That is, it seems that house GOP candidates are currently outperforming Donald Trump, but not by very much.
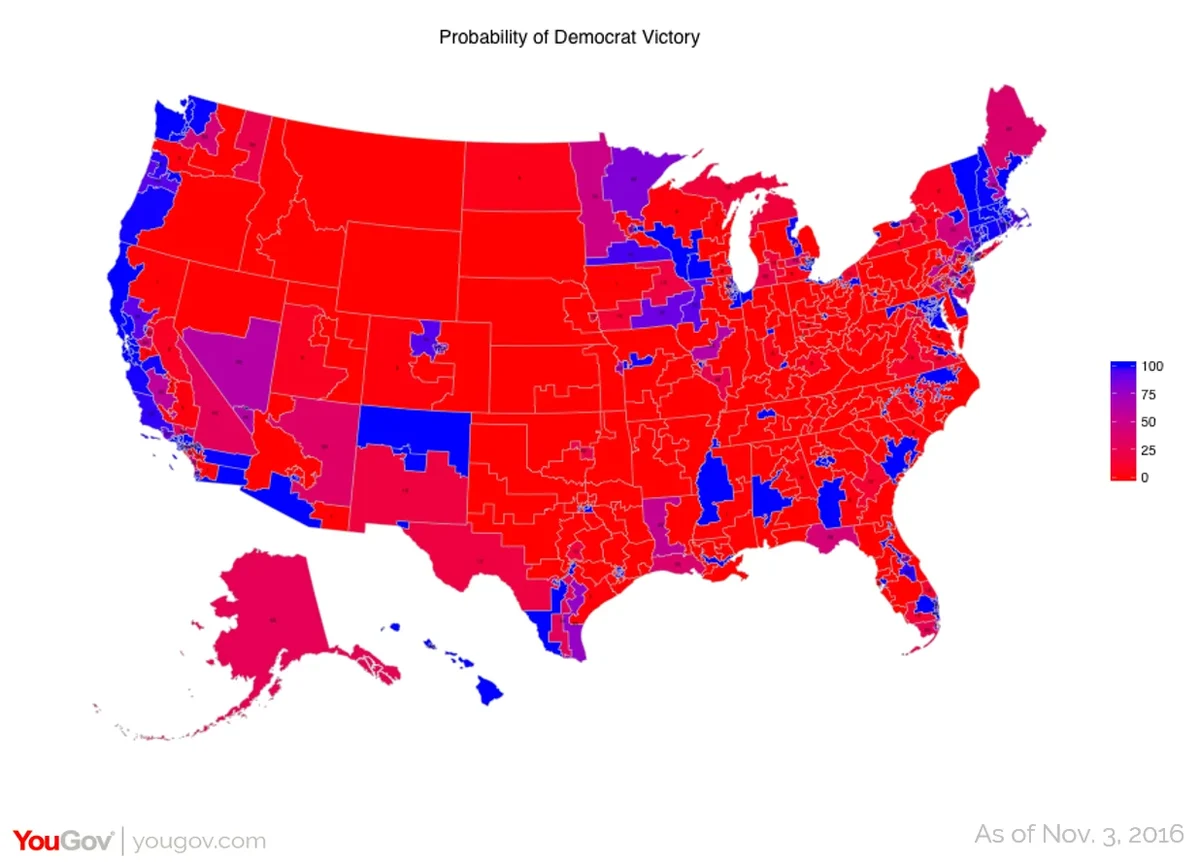
Second, in terms of how these national figures translate into seats, our model suggests there is a 92% chance that the Democrats will increase their share of seats in the House. Despite their popular vote lead, the Democrats are forecast to win only 198 of 435 seats (95% interval from 185 to 213 seats), as their vote is inefficiently concentrated in a minority of districts. This means that we expect a 10-seat swing away from the Republicans (95% interval from -3 to +25 seats). In the cluster of seats that they would need to win in order to secure a majority, the Democrats are projected to receive only 46% of the two-party vote, on average. The upshot is that we believe there is very little chance that the Democrats will win back control of the House. The House is likely to be numerically similar to the House resulting from the 2012 election, which had 234 Republicans and 201 Democrats.
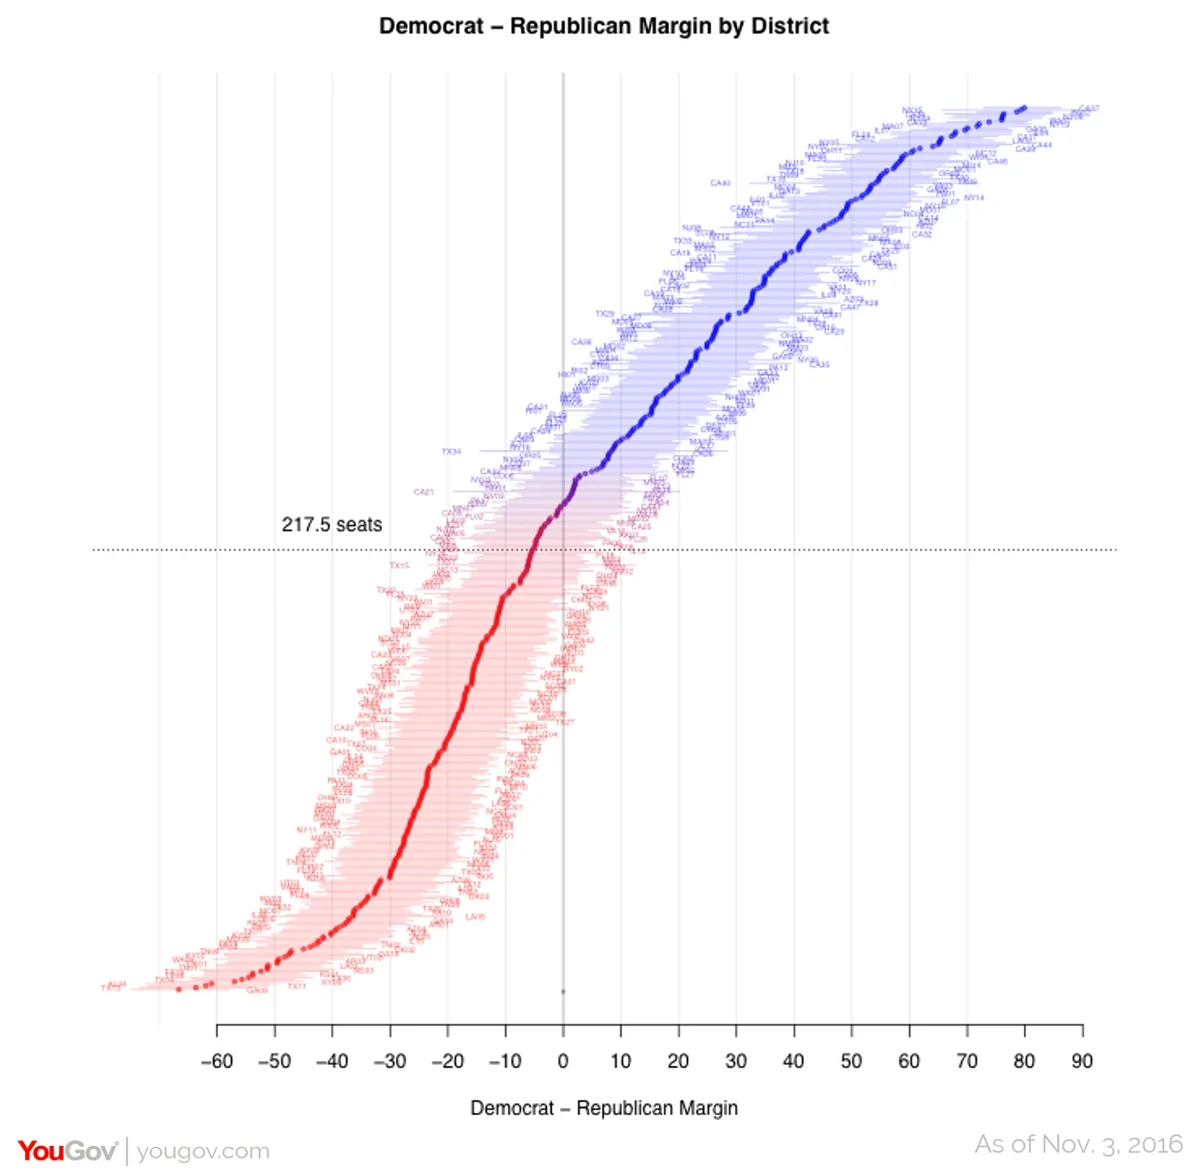
These estimates do not take into account candidate-level details, but just general demographic and political patterns in candidate support. We do not have very many respondents per district, so the model will get a significant number of marginal seats wrong (we have identified a few specific seat predictions that we do not believe) but we still think it provides a reasonable expectation for how the national House vote will translate into seats.