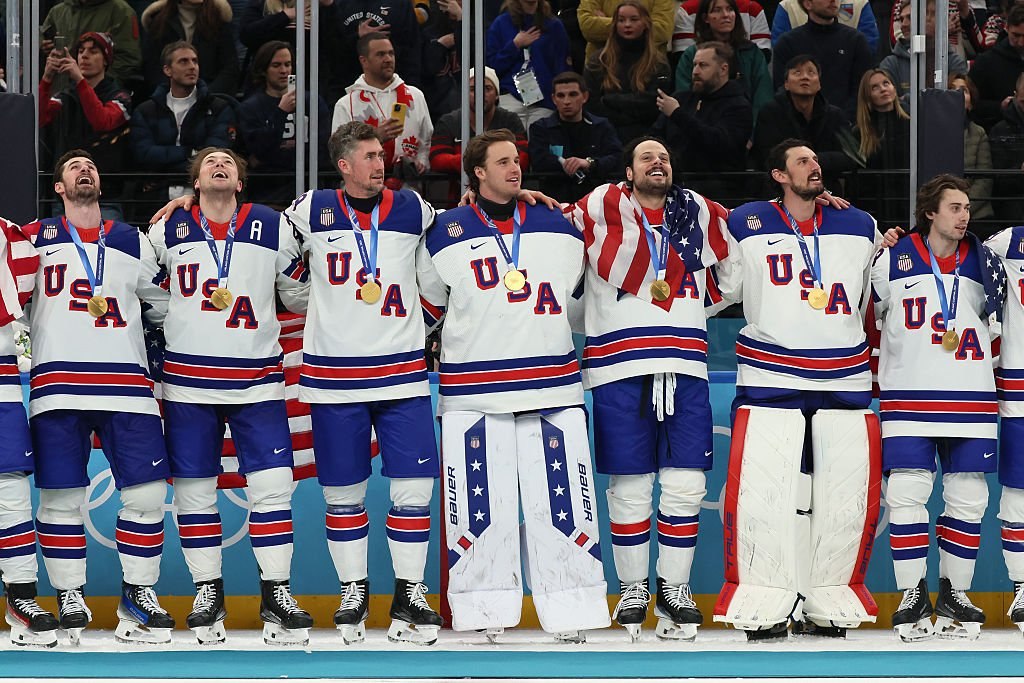
There are moments when a sport breaks out of its usual cadence and into the wider cultural conversation. For ice hockey in the U.S., the Winter Olympics delivered exactly that. With both the men’s and women’s teams striking gold, the sport found itself in the national limelight.
The question now is whether that glow has translated into something more tangible for the NHL. Has the Olympic success nudged more Americans toward considering the league?
YouGov SportsIndex data suggests that;while the shift is not dramatic, it is present — and in a market as mature and competitive as the U.S., even modest gains can carry weight.
NHL consideration ticks up after Olympic gold wins
Across the last quarter, Consideration for the NHL among all U.S. adults shows a gradual uplift following the Olympic wins in mid-February.
YouGov’s BrandIndex Consideration metric measures the share of the audience that say they would consider attending a league in the absence of price or geographical barriers. From a baseline hovering in the mid-14s through January and early February, scores begin to climb steadily from February 14 – around halfway into both the men’s and women’s events – onwards. The score reached 17.3 by mid-March — the highest point in the period measured. This amounts to a 21% increase in Americans saying they would consider going to NHL matches.
A similar trajectory is observed among sports fans specifically, where Consideration rises from around 18.3 pre-Olympics to a high of 20.7 on March 15. Among women, the increase is particularly notable, climbing from the low 12s to a high of 15.1 by late March — a two-year peak for this audience. Similarly, the post-Olympics gains in Consideration logged fresh two-year highs among the general population as well as sports fans subsets.
Among men, the post-Olympics peak comes in at about 20.4 from 15.7 at the start of the observation period – amounting to a 30% increase.
These movements are based on a robust daily sample of over 3,000 U.S. adults, using an eight-week moving average. That lends weight to what might otherwise appear to be relatively small shifts. In a landscape where established leagues are constantly vying for marginal gains, such upward movement — particularly across multiple audience segments — can be seen as a positive signal.
Which NHL teams lead among game considerers in the U.S.?
Looking at which teams enjoy the strongest support base among those considering attending NHL games, the league’s traditional powerhouses continue to lead.
The Chicago Blackhawks and Boston Bruins top the list, each drawing interest from 10% of prospective attendees. Close behind are the Detroit Red Wings at 9%, followed by a cluster of teams — including the New York Rangers, Pittsburgh Penguins, and Philadelphia Flyers — each at 8%.
Notably, four of these teams — the Blackhawks, Bruins, Red Wings, and Rangers — are part of the NHL’s “Original Six,” underscoring the enduring pull of the league’s most historic franchises. The Penguins and Flyers, meanwhile, were among the teams introduced during the NHL’s first major expansion in 1967. It is perhaps no surprise that franchises with such deep-rooted hockey heritage continue to dominate Consideration in the U.S.
Further down, teams like the Colorado Avalanche, St. Louis Blues, Tampa Bay Lightning, and Washington Capitals round out the top ten, each attracting between 5% and 7% of consideration.
Taken together, the data combines YouGov Profiles insights on team preference with YouGov SportsIndex tracking of league-level Consideration — offering a view of both where interest is rising and how it may translate at the team level.
Methodology: YouGov BrandIndex collects data on thousands of brands every day. NHL’s Consideration score is based on the question: If there were no obstructions with price or geography, which of the following sporting events/leagues would you consider most going to? Scores are reported as percentages, based on daily surveys of U.S. adults. Data is weighted using a propensity scoring methodology with targets from the American Community Survey (ACS) to ensure representation by age, gender, race, education, and region. Figures are shown as a 8-week moving average with an average daily sample size of over 3000 U.S. adults between December 2025 to March 2026.