Sponsorship value is influenced by a range of factors—from overall event viewership to the platform, market, and medium through which the content is consumed. However, one of the most critical and often underappreciated drivers is the quality and duration of on-screen brand exposure—and how that exposure is perceived by viewers.
YouGov Sport evaluates exposure through two complementary lenses: Brand Impact Score (BIS), which measures the quality of on-screen presence, and Brand Health, which reflects how the brand is perceived by consumers (more specifically sport fans across a global survey panel of 29 million people). Unlike traditional sponsorship valuation models, YouGov combines both to calculate a more accurate and meaningful Net Sponsorship Value (NSV).
To demonstrate just how this is achieved, and the impact it can have for sponsorship managers looking to enhance their brand partnership value, YouGov Sport analysed player jersey sponsorship exposure across 23 teams, 4 sports, 17 brands, 13 competitions, and 8 countries.
Team Jersey sponsors that we analysed:
- AC Milan (Emirates)
- Arsenal Men (Emirates)
- Arsenal Women (Emirates)
- Brisbane Broncos (Asics & Kia)
- Collingwood Magpies Men (Emirates, KFC & Nike)
- Collingwood Magpies Women (AIA, KFC)
- Geelong Cats Men (Cotton On)
- Geelong Cats Women (Cotton On)
- Hawthorn Hawks (KFC)
- Leeds United (Red Bull)
- Milwaukee Bucks (Motorola)
- Mumbai City FC (Etihad)
- North Queensland Cowboys (Toyota)
- Olympique Lyonnais (Emirates)
- Port Adelaide (KFC)
- Real Madrid Men (Emirates)
- Real Madrid Women (Emirates)
- Richmond Tigers (KFC)
- S.L. Benfica (Emirates & Adidas)
- Sydney Swans (Nike)
- Wallaroos (Asics & Cadbury)
- Western Bulldogs Men (Asics & Mission Foods)
- Western Bulldogs Women (Pancake Parlour)
Competition sponsors with jersey patches that feature in this research:
- Vertu Trophy specific jerseys (Vertu Motors)
- NRL Telstra Premiership (Telstra)
Starting with on-screen presence (Brand Impact Scoring rather than Brand Health assessments), Motorola emerged as the top-performing brand, generating both the highest number and longest duration of exposure instances across Milwaukee Bucks matches. It achieved an impressive average BIS of 3.65 out of a maximum of 5.00.
BIS is calculated using five key factors: the size of the brand when on screen, its centrality, the duration of each appearance, the number of competing brands visible at the same time, and the number of brand iterations shown. For jersey sponsorships, the final factor is typically irrelevant, as it's uncommon to see multiple brand placements on a single shirt. However, the remaining factors all significantly influence exposure quality.
In Motorola’s case, it was the length of each exposure instance that drove its high impact score—thanks in large part to the nature of NBA broadcast coverage. Basketball’s style of play lends itself to longer, more focused camera shots—particularly during offensive build-ups—which naturally favour clear, sustained visibility of jersey logos. These zoomed-in angles offer a level of exposure that’s harder to achieve in sports like football, where the camera tends to follow the ball more dynamically and from a greater distance. Motorola’s strong BIS performance highlights how sport-specific camera dynamics—like those in the NBA—can significantly enhance brand visibility, reinforcing the importance of context in sponsorship valuation.
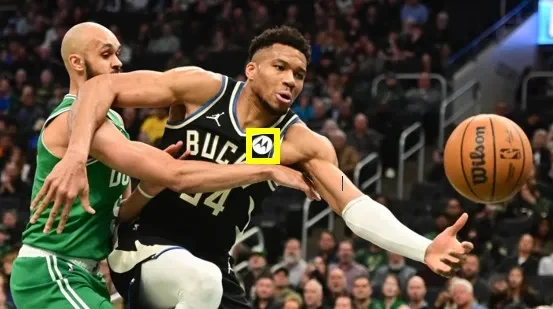
Image: Motorola’s presence on Milwaukee Bucks jersey
Emirates branding across the eight football teams shirts it sponsors generated an above average BIS of 3.14 within YouGov Sport’s proprietary Image Recognition Tool ‘Theia’. For the Emirates logo, it was its size when on the screen that garnered more impact than other jersey brands; the large central positioning on team kit helped to ensure it was picked up clearly across camera angles.
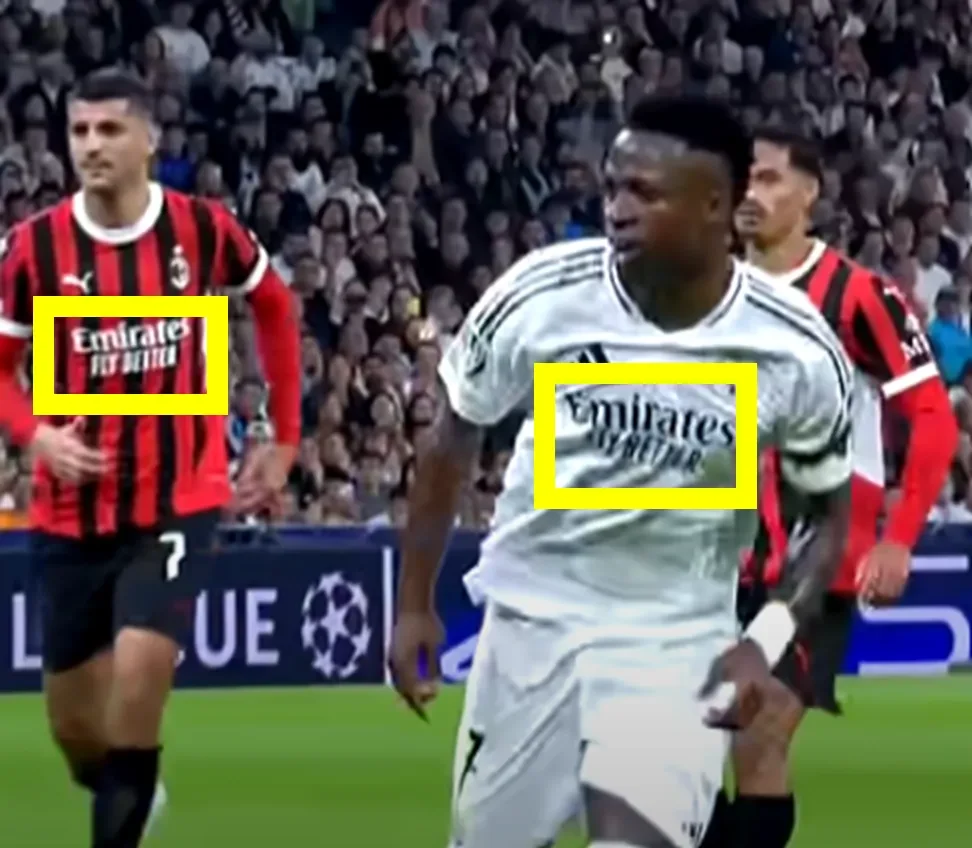
Image: Emirates jersey sponsorship of several football teams always ensures the brand is front and centre in match coverage
Of all the jersey brands YouGov Sport monitored for this analysis, it was AIA’s positioning on the Collingwood Magpies Women’s jersey that scored highest in terms of screen centrality. The brand, albeit smaller than others that YouGov Sport reviewed, featured in the 50% of the screen for the majority of AFLW coverage, which would have converted more potential sponsorship value for the brand into a reality.
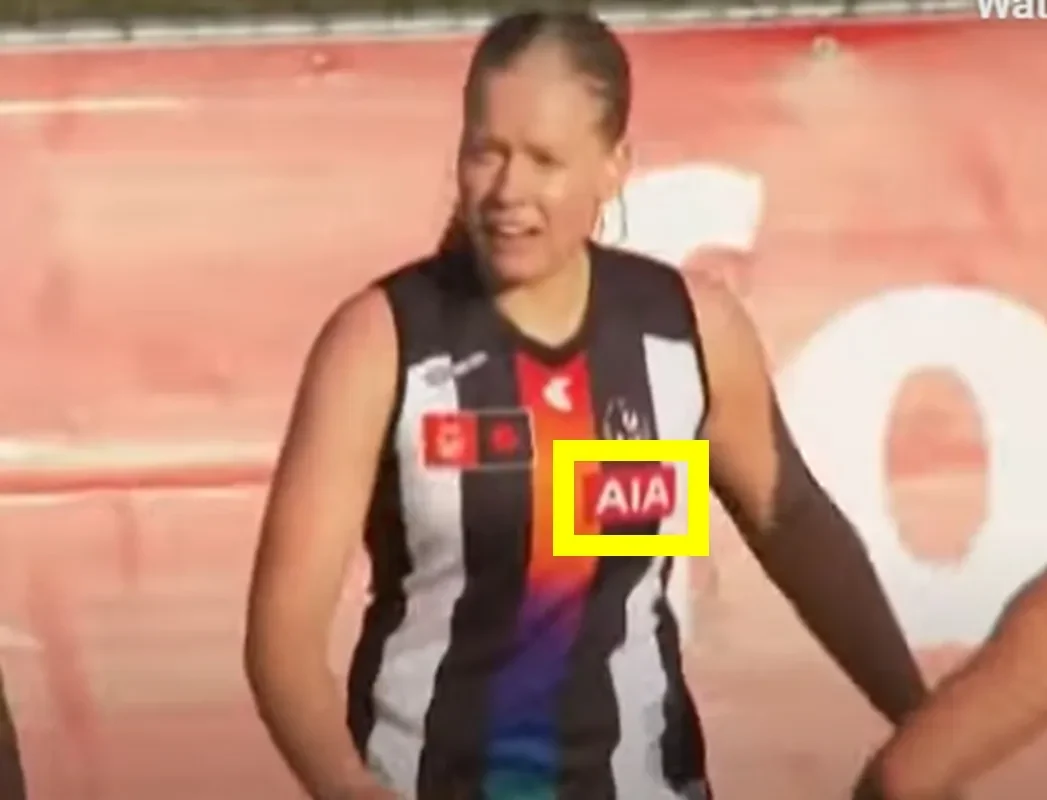
Image: AIA’s sponsorship of the Collingwood Magpies Women’s jersey
Second to AIA in terms of centrality was Telstra, specifically the NRL Telstra Premiership logo that features on all NRL player shirts. Not only was this logo prominently central throughout match footage, but its presence on all player kit meant that despite its small size (smallest across all brands we researched), it was present for 9.4% of match coverage, yielding an impressive exposure per hour of 5 mins and 37 seconds.
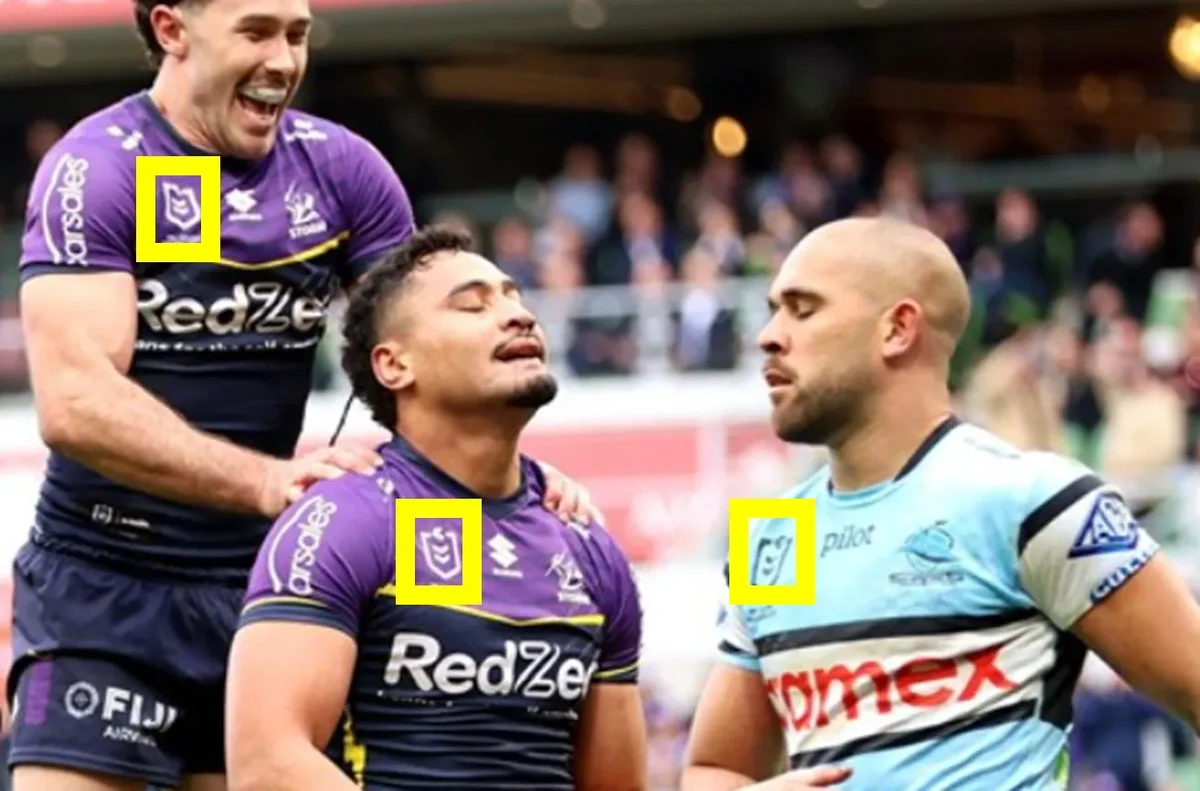
Image: NRL Telstra Premiership logo features on each NRL player’s shirt.
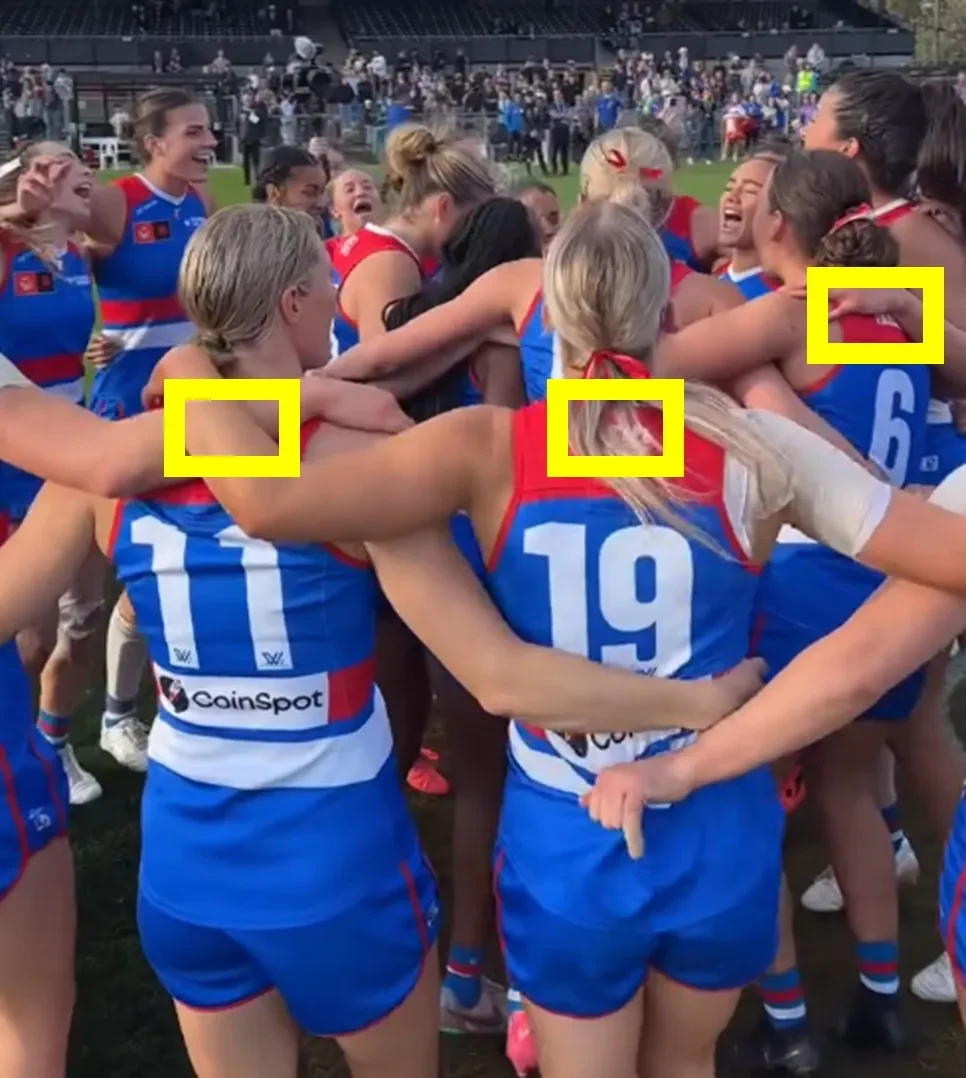
A brand with potential through some repositioning is Pancake Parlour (featuring on the back of the Western Bulldogs Women’s AFLW kit). As shown in the images below, the brand is often blocked by player ponytails.
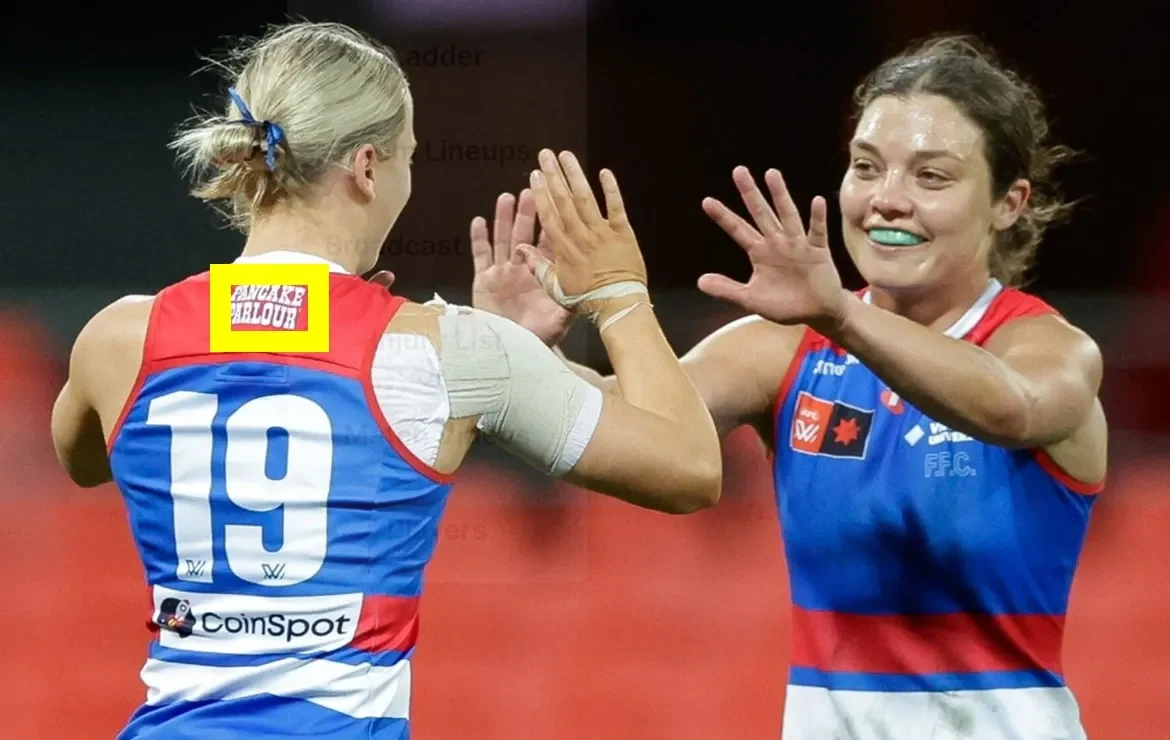
Images: Western Bulldogs Womens team kit featuring Pancake Parlour sponsorship
The table below provides a summary of how each brand performed in terms of on-screen presence. It includes each brand’s Brand Impact Score (BIS) for jersey sponsorship, along with rankings across various BIS components and NSV metrics. As the data shows, it’s uncommon for a brand to excel across all contributing factors—there are often trade-offs. For instance, a larger logo may increase visibility and reduce brand clutter, but it can also limit how often the logo appears in the central 50% of the screen.
That said, there is always room for optimisation. This is where YouGov Sport’s consultative approach adds real value—helping clients identify where improvements can be made to maximise both exposure quality and brand impact.
As was outlined earlier, BIS is only one part of the equation when evaluating a brand’s sponsorship impact and its ability to drive strong NSV. Equally important is Brand Health—a measure of how a brand is perceived and how well it connects with sports audiences.
YouGov’s BrandIndex tracker captures this by surveying consumers on their perceptions of thousands of brands across 16 key metrics, including Advertising Awareness, Net Promoter Score (Recommendation), Word of Mouth, Purchase Intent, Consideration, Customer Satisfaction, Quality, and Value. (More details available at: YouGov Brand Health.)
YouGov Sport incorporates this data by applying an uplift to a sponsor’s valuation when its BrandIndex score shows a positive shift within seven days of sport event exposure. This enhancement is captured in a new metric: BIS-X. A higher BIS-X indicates not just strong visibility, but also positive audience engagement and brand resonance.
This approach allows for a more accurate conversion between Gross Advertising Value (GAV) (the theoretical maximum based on exposure volume and audience size) and Net Sponsorship Value (NSV) (the actual value achieved, factoring in exposure quality and brand resonance).
Chart: YouGov BrandIndex tracker across key brands and team/league host markets between June 2024 to June 2025. Please note, full BIS-X calculations account for all markets where the competition is aired and not just host markets. The deep dive analysis of host markets in this article is purely for more concise methodological demonstration reasons.
Among the brands analysed by YouGov Sport, some demonstrated significantly stronger brand health—and therefore greater sponsorship value uplift—than others. As shown in the graphs below, Toyota and Cadbury stood out with particularly high BrandIndex scores, benefiting their associated teams: the North Queensland Cowboys and the Australian Men’s and Women’s Rugby Union teams, respectively.
Toyota’s brand health in the Australian market is exceptionally strong across all measured factors, with Impression and Quality scores ranking among the highest of all brands included in the study. It’s no surprise, then, that Toyota’s association with the North Queensland Cowboys delivered a 6.3% uplift in NSV.
Cadbury followed closely behind, achieving a 4.5% uplift through its partnerships with the Wallabies and Wallaroos. With already strong scores in Impression, Satisfaction, and Quality, the brand stands to gain even more by generating additional buzz around its national team sponsorships.
Conversely, Red Bull—Leeds United’s front-of-shirt sponsor—recorded a negative BrandIndex score over the 2024/25 football season. As a result, the brand did not receive any additional uplift in NSV from its association with the club. A closer look at the data reveals that Red Bull’s biggest challenges lie in consumer perceptions of value and overall brand impression, both of which are underperforming relative to other sponsors.
Turning the spotlight to Emirates, consumer perceptions of the brand are notably stronger in the UK than in Spain or France. As a result, the brand health uplift associated with its sponsorship of English club Arsenal is greater than that seen for its partnerships with Real Madrid (Spain) and Olympique Lyonnais (France). Emirates’ brand health is largely driven by strong scores in Impression and Quality, though slightly tempered by lower perceptions of Value.
Thanks to this overall positive sentiment, Emirates—as a global sponsor across its football jersey portfolio—achieved an average 2.6% uplift in NSV. This uplift was driven purely by brand association, amplified by its prominent presence on the kits of high-profile clubs such as AC Milan, S.L. Benfica, and Real Madrid, among others.
We previously highlighted the potential for Pancake Parlour to enhance the brand impact score of its AFLW sponsorship by repositioning its Bulldog’s jersey logo, which currently sits too close to players’ hairlines and is often obscured during broadcasts. But beyond improving visibility, the brand also has room to grow in terms of brand health. Its current BrandIndex scores remain modest, weighed down by weaker perceptions of Value and limited Buzz. However, sport presents a valuable opportunity to generate that buzz—and if leveraged effectively, this could help lift overall Impression and significantly increase sponsorship returns. At present, Pancake Parlour’s partnership with the Western Bulldogs Women’s team is delivering a modest 0.8% uplift in NSV, suggesting there’s considerable headroom for improvement.
As demonstrated in the table of brand impact results below, Emirates dominated across the 16 brands analysed, securing six of the top seven spots for effective conversion of GAV to NSV. Achieving an NSV that exceeds 50% of the gross potential is no small feat—especially when most brands hover closer to the one-third mark. Emirates’ success is a testament not only to its strategic placement on high-visibility kits but also to the strength of its brand perception across key markets.
This is where YouGov Sport’s methodology breaks new ground. By integrating exposure quality with real-time brand perception, we move beyond traditional media valuation to deliver a more complete and accurate reflection of the true value driven by sponsorship. In a landscape where visibility alone is no longer enough, YouGov’s BIS-X model ensures that brand value is a reflection of what’s felt, as well as what’s felt.
To learn more about how YouGov Sport can help you unlock the full value of your sponsorships, get in touch with our team.
Image Credit: Pixabay via Pexels