
Social Democrats on course to be the largest party, with Danish People’s Party and Green Left making the biggest gains
Key takeaways
- Centre-left Social Democrats lead on 20% of the vote, though this is down eight points from 2022
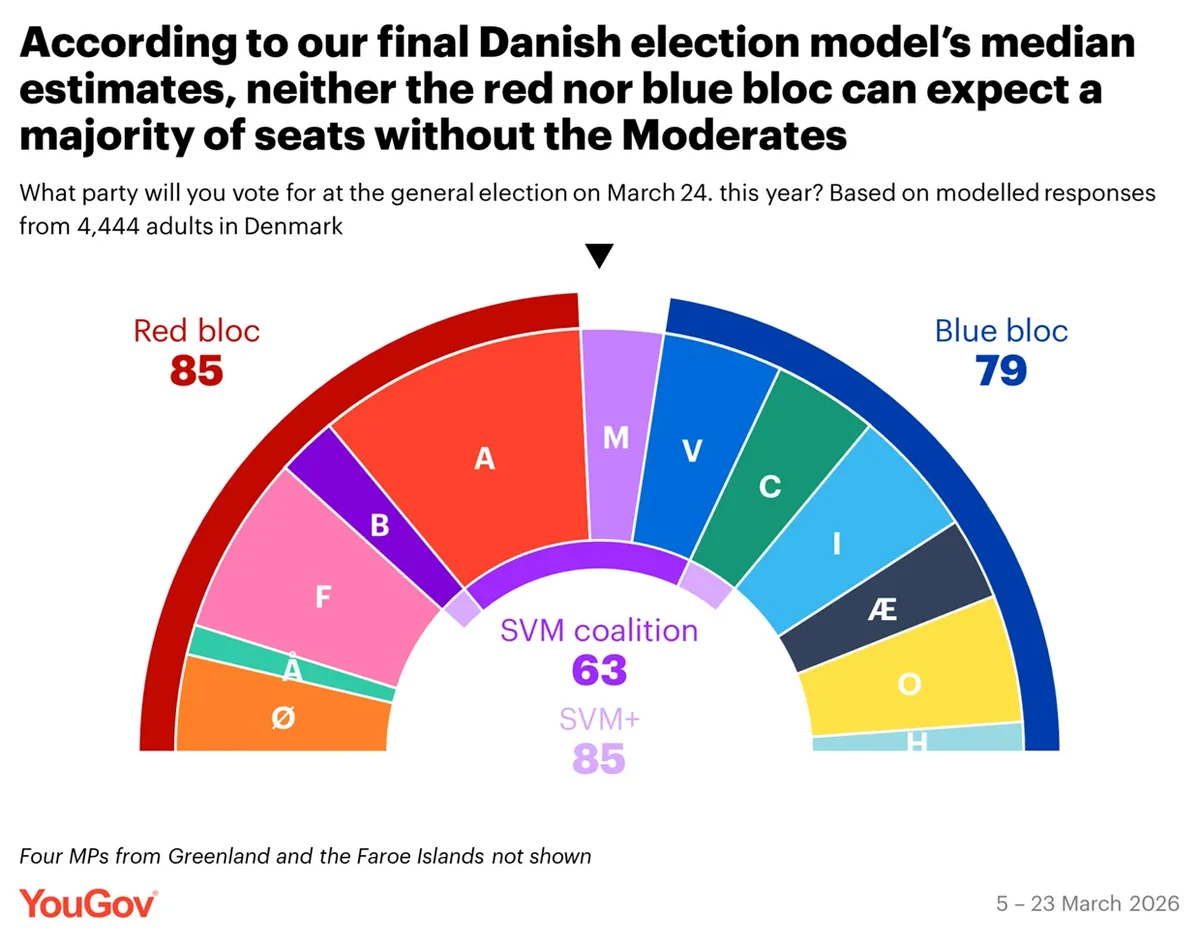
- Parties of the collective left-of-centre ‘red bloc’ have a slight edge of parties of the collective right-of-centre ‘blue bloc’ in our model’s central estimate, with each requiring the centrist Moderates to gain a majority
- Danish People’s Party, the Liberal Alliance and Venstre are each vying to be the largest party in the blue bloc in a very close race
- Current governing ‘SVM’ coalition between Social Democrats, Venstre and Moderates extremely unlikely to win enough seats to be able to remain in office by itself
The final YouGov projection of the 2026 Danish general election continues to show a close race between the two main blocs of parties, with little significant movement since our first projection last week. According to our model, the centre-left Social Democrats of prime minister Mette Frederiksen are still on course to remain the largest party in the Folketing, despite her governing coalition being highly unlikely to win enough seats to stay in power by itself.
The new YouGov model, launched last week for our first projection of the Danish election, is the first of its kind – a Looped Stratified Simulation (LSS) election model. This method leverages one of YouGov’s strongest assets, our world-leading panel, to simulate elections under thousands of different assumptions about individual-level vote choice and likely electorates, before pooling these estimates into probability distributions. From these, we can draw central, lower, and upper bounds for party support and expected seat wins, as well as a range of other electoral statistics. In total, we spoke to 4,444 Danes from 5-23 March, including 1,744 fresh interviews since our first projection.
Our final model’s central estimate projects that the Social Democrats will win 36 of the Danish parliament’s 179 seats from approximately 20% of the vote, though this is much reduced from the 50 seats and 28% vote share they won in 2022, and would be the party’s worst result in more than a century. All vote and seat shares, including the above, are subject to a probabilistic range of outcomes drawn from the simulations, which can be seen below.
The other parties in the current government – the centre-right Venstre and centrist Moderates – are also expected to suffer losses, being projected to win 16 and 11 seats respectively, down from 23 and 16 last time. This would leave the incumbent coalition with just over a third of seats (63) in parliament, making it very likely that new governing arrangements will be required. It would also be Venstre’s worst showing in their 156-year history.
Prior to the last election, governments in Denmark were typically formed from some combination of parties from one of two blocs – a right-of-centre ‘blue bloc’ and left-of-centre ‘red bloc’. With expectations of a return to bloc-based politics, our model projects overall gains for the ‘blue bloc’ parties, on 79 seats in Denmark itself, up seven, resulting in a near-tie with the ‘red bloc’ parties, who are on 85 seats in the median estimate, down two.
Driving gains for the blue bloc are the populist Danish People’s Party, projected to win 17 seats, having fallen to just 5 at the last election. The Liberal Alliance are on course for a matching haul of 17 seats, up three, with the Conservatives projected to win 14 seats, up four.
The populist Denmark Democrats party are on 11 seats, relative to 14 seats won last time, with the new pro-referendum Citizens’ Party just scraping into parliament if the results of our central projection come to pass – just meeting the 2% national threshold, earning them 4 seats. However, it is well within the range of possibility that the new party does not make the cut-off (see below).
Within the red bloc, the two socialist parties are expected to make significant advances. The Green Left are likely to end up as the second largest party on 24 seats, a gain of nine, while the more left-wing Red-Green Alliance have a central projection of 13 seats, up four. Minimal changes in seats are estimated for the more centrist Social Liberals (8 seats, +1) and the environmentalist party The Alternative (4 seats, -2).
Denmark’s version of proportional representation includes a 2% vote share threshold that parties need to pass in order to win seats (with some exceptions). Although our model gives a central vote share projection of just over 2% to both the Citizens’ Party and The Alternative, it shows lower bounds for both parties of less than 2%, making it within the range of possibilities for them to win zero seats.
A feature of our LSS election model is that it allows us to attribute expected probabilities of The Alternative and the Citizens’ Party making it into parliament. As of today, these probabilities stand at 81% and 51% respectively. While we are therefore reasonably confident that The Alternative will make it into the Folketing, we cannot give any certainty either way regarding the Citizens’ Party’s prospects.
Who could form the next Danish government?
With no party expected to win much more than a fifth of seats in the Folketing, some arrangement involving multiple parties will be required to form Denmark’s next government.
According to our model’s central estimates for each party, neither the red nor blue blocs would hold a majority by themselves, with each requiring the Moderates’ estimated 9 to 14 seats to get over the line.
Again, our LSS model allows us to estimate the probability of each coalition arrangement getting a majority of seats. While there is no majority for either bloc in the overwhelming majority of model simulations, in a small number (6%) the red bloc wins 90+ seats. This compares to a negligible number (less than 1%) for the blue bloc.
All of which points toward The Moderates taking their regular status as prospective ‘kingmakers’ between the blocs. According to our model today, adding the Moderates to the red bloc results in a majority more than 98% of the time. Adding them to the blue bloc results in a majority around 25% of the time. These figures, particularly on the blue bloc side, have shifted a little since out last model owing mostly to there being slightly more uncertainty in the upper bound seat estimates for the top three parties vying for first place in the bloc (the Danish People’s Party, the Liberal Alliance, and Venstre).
A continuation of the SVM government falls short of an overall majority, even if it was expanded to include the adjacent Conservative and Social Liberal parties (sometimes known as SVM+). These potential coalitions would secure majorities in less than 1% of our model simulations.
Nonetheless, Denmark has a long history of minority governments. The combinations below show the groups of parties, based on our median projections, that could support the various potential coalitions, even if they do not directly take part themselves.
In addition to these seats, Greenland and the Faroe Islands elect two MPs each, though with both territories having their own party systems. At the last election, this added three MPs to the red bloc and one to the blue bloc, though all four have supported the SVM coalition. On our central projection, should all four of these North Atlantic seats decide to support the red bloc, they would be just one seat shy of the 90 required for a majority.
While such support from all four elected members from Greenland and the Faroe Islands is unlikely, this particular coalition sum indicates just how close to the winning line the red bloc currently are in our central projections.
You can explore possible coalition combinations, based on median seat projections, with our custom coalition builder below.
How have Danish voters moved since the 2022 election?
Using a stratified and weighted sub-sample of 2,750 Danes that we spoke to over the past two-and-a-half weeks, we can take an in depth look at the voting patterns driving this result.
The largest movement of voters since the last election has been from the Social Democrats to the Green Left, who have won 15% of those who backed the centre-left party in 2022 and intend to vote next week. With 66% of 2022 Social Democrat voters still backing the party, this single shift represents close to half of all their losses, with other individual parties only absorbing up to 4% of any voters moving away from the party since 2022.
Venstre have held on to just half of their 2022 voters (49%), with these voters fragmenting and now telling us they intend to vote predominately for either the Conservatives (14%), Danish People’s Party (10%), or Liberal Alliance (9%).
The Danish People’s Party’s new voter coalition also includes 30% of those who backed the Denmark Democrats in 2022 and 31% of those who backed the more radical New Right, who are ineligible to run in this year’s election.
The Green Left have won a quarter (25%) of those who previously backed their more left-wing competitor the Red-Green Alliance, while the Liberal Alliance’s gains include 13% of those who voted Conservative in 2022.
How are different social groups in Denmark voting?
When it comes to the social divides apparent in Danish voting patterns, the important differences can be as much within the blocs as between them.
For instance, when it comes to education levels, support for the blue bloc is a bit higher among those without a university education (48%) than among those with a degree (41-42%).
However, this difference is driven by a quarter of those without a degree (24%) backing one of the three right-wing populist parties, relative to just 5% of those with the highest level of education (a long-course and/or postgraduate degree). Support for the other blue bloc parties is actually greater among those with higher degrees (36%) than those without a degree of any kind (24%).
Similarly, while support for the Social Democrats, the largest party in the red bloc, increases with age, with over 67s roughly twice as likely to back the party as the under 50% (31% vs 14-15%), support for other red bloc parties tends to be strongest among younger Danes, with 42% of 18-34 year olds collectively backing them, relative to 17% of over 67s.
Blue bloc support peaks at 52% among 50-66 year olds, driven by a higher level of support for right-wing populists among this age group, while support for the Liberal Alliance is highest among younger Danes.
Denmark is home to a significant gender divide in voting patterns, with women favouring the red bloc by a sixteen point margin (55% to 39%), while men are nine points more likely to back a party in the blue bloc (51% to 42%).
Again, this is not uniform within the blocs, with women more likely than men to back the Social Democrats (23% vs 18%) or Green Left (18% vs 10%), while support for the Liberal Alliance is roughly twice as high among men than women (13% vs 6%).
Denmark does not have the largest regional divide in voting patterns, though the region of North Jutland favours the blue bloc by 52% to 38%, while support for the red bloc is higher in the capital city region (52% to 41%) and mid Jutland (51% to 44%).
The southern regions of South Denmark and Zealand are evenly split 47-48% to 46-47% between the two blocs.
Interested in taking YouGov surveys? What’s your view on Danish politics, and everything else? Have your say, join the YouGov panel, and get paid to share your thoughts. Sign up here.
Interested in commissioning YouGov research? We connect in real-time with real people around the world to gather their thoughts, behaviours, and opinions, to ensure that our research data is powered by reality. Explore our survey services here.
Photo: Getty