At the end of Keir Starmer’s premiership, YouGov takes a detailed look at voting intention across multiple factors, including age, education, ethnicity and social media use
Key takeaways
- With Keir Starmer’s premiership drawing to a close, just 41% of 2024 Labour voters still back the party
- Labour’s support has collapsed over the last two years, particularly in areas of previous strength, though the party still leads among black Britons, and does better among those with a degree and from higher and professional occupations
- Reform UK records its highest vote shares among Leave voters, those with lower levels of education, and those from routine and manual occupations, while doing better among older Britons
- The Greens continue to lead among the under-30s, while also finding high levels of support among lesbians and bisexuals, and Pakistani or Bangladeshi voters
- Support for the Conservatives remains highest among the oldest Britons, with the party additionally leading among British Indians
- Restore Britain’s support comes primarily from 2024 Reform UK voters, while being highest among those who are long-term unemployed or work in routine occupations, as well as among users of X
Just two years on from winning a landslide majority in the 2024 general election, Keir Starmer is on his way out as prime minister, having presided over a significant collapse in support for Labour, at a time when wider voting patterns have been transformed by substantial changes in the British party system.
To examine the shifts that have taken place over these first two years of the parliament, and the political landscape being inherited by Starmer’s successor, we have used a sample of nearly 20,000 Britons to examine how Britain would vote today, broken down by all the key demographic and political divides.
How would Britain vote, two years since the 2024 election: by age
Over the last few general elections, age has emerged as one of the strongest dividing lines in British politics. While this shows no signs of disappearing, it has evolved a little since Labour took nearly two-thirds of the vote among the youngest Britons in the 2017 election.
Labour’s support today is still lowest among older Britons, with the party on just 12% of the vote among the over-70s, but is reasonably consistent among the under-60 age groups, at between 19-22% of the vote, mirroring a trend seen in the recent elections in Scotland and Wales.
Instead, it is the Greens who are now the most popular party among younger Britons, leading among the under-30s and taking as much as 39% of the vote among the 18-24 age group. The left-wing party’s support declines sharply with age, with the Greens on as little as 4% of the vote among the over-70s.
By contrast, support for both Reform UK and the Conservatives is highest among older Britons, with both parties each taking around a third of the vote among the over-70s (32-33%) but falling to single digits among the youngest age group (6-9% of 18-24 year olds). However, the two parties’ relationships with age are not identical, with Reform UK winning higher shares among those in their 50s and 60s (29-34%) than the Tories (17-22%).
Support for Restore Britain, Rupert Lowe’s breakaway from the right of Reform UK, does not follow this pattern, taking 5% of the vote among the under 40s age groups, but just 2% among those in the over 70s.
The Liberal Democrats are on 12-15% among every age group.
Overall, the median age of a Labour voter is now 48, compared to just 37 for the Greens, 50 for the Lib Dems and 60 for both the Conservatives and Reform UK.
How would Britain vote, two years since the 2024 election: by gender
Increasingly, there is a noticeable gender gap in how Britons intend to vote, with this greatest for Reform UK. Although Nigel Farage’s party currently has the backing of 29% of male voters, eleven points more than any other party, just 21% of women intend to back Reform UK, the same proportion that would vote for the Tories.
Indeed, in contrast to the radical right, the Conservatives do a little better with women (21%) than men (18%), something also true of the Greens, at the other end of the spectrum. Zack Polanski’s party holds an 18% share among women, relative to taking 13% of the vote among men.
Support for Labour is at a consistent 18% of the vote among both men and women.
How would Britain vote, two years since the 2024 election: by ethnicity
Historically, most ethnic minority communities were associated with Labour, but some of these links have frayed in recent years. Although Labour still wins a higher vote share among ethnic minority Britons than among white Britons, they now only hold a clear lead among black Britons, where they take 39% of the vote, 14 points more than any other party.
Among British Indians, the Conservatives today lead on 31% of the vote, ahead of Labour and the Greens on 21-23%. Additionally, Kemi Badenoch’s party now holds the same 19% share among black Britons as it does among white Britons, though with only 5% of Pakistani or Bangladeshi voters backing the party.
The Greens hold more support among ethnic minority Britons than among white Britons, though this partially a reflection of ethnic minority Britons tending to be younger. Nonetheless, the party has a particular area of strength among those of Pakistani or Bangladeshi heritage, where the party holds a 37% share, relative to Labour on 28%.
Such voters are also particularly likely to back ‘others’, with Pakistanis and Bangladeshis the only demographic group where Your Party currently holds a non-negligible vote share (5%).
Reform UK perform poorly among ethnic minority voters, though do still attain 13% of the vote among Britons who identify as mixed race, even if this compares to 27% of the vote among white people.
There’s little difference in levels of support for the Lib Dems between ethnicities, with the exception of black Britons, among whom Ed Davey’s party holds a lower 7% of the vote.
How would Britain vote, two years since the 2024 election: by sexuality
One of the Green Party’s particular areas of strength is among those who do not identify as heterosexual, with the party holding as much as a 56% vote share among bisexual women, while also leading by significant margins among lesbians (on 46% of the vote) and bisexual men (on 36%).
The Greens hold a lower 23% vote share among gay men, though this is still roughly twice their level of support among both straight men and women (11-13%). Again, though, this is in part influenced by gay and bisexual Britons tending to be younger than straight Britons.
By contrast, Reform UK do better among straight Britons, though with the gender gap still very much apparent. Indeed, Nigel Farage’s party does nearly as well among gay and bisexual men (18-20%) as among heterosexual women (23%), while falling to the low single digits among bisexual women.
The Conservatives likewise hold a higher level of support among straight Britons. But while the party does better among straight women than straight men (23% vs 19%), the Tories have a 15% vote share among gay men, but just a 4% share among lesbian women.
How would Britain vote, two years since the 2024 election: by education level
Someone’s level of education has become one of the strongest indicators of how people in Britain vote.
While Reform UK currently hold a 40% vote share and 19 point lead among those whose highest level of education attained is a GCSE or lower, they are fifth placed among those who hold a university degree, on just 14% of the vote.
Graduates are more likely than those with only GCSEs or lower to back either Labour (23% vs 12%), the Greens (20% vs 8%) or the Liberal Democrats (17% vs 8%), with the collective vote share for these three ‘progressive’ parties standing at 60% of degree holders, roughly double their support among those with a lower level of qualification (28%).
Support for the Conservatives is reasonably consistent across education levels, at 18-21% of the vote.
How would Britain vote, two years since the 2024 election: by socio-economic status (NS-SEC)
Although class voting was for a long time seen as dying out, looking at today’s voting patterns by socio-economic classification (NS-SEC), the contemporary successor to the ABC1/C2DE system (NRS), would suggest that it’s somewhat in play at present.
Britons who are in routine or manual jobs (or who were, if they are now retired) are nearly twice as likely to vote for Reform UK than those from managerial or professional occupations (35% vs 18%), with Nigel Farage’s party additionally holding the highest vote share (27%) among those in the ‘intermediate’ occupations category.
The other major parties tend to do better among those in the higher managerial and professional category, among whom Labour and the Conservatives take 22% of the vote each, relative to 14% and 18% respectively among Britons whose most recent job was in a routine or manual role.
Breaking the classifications down more granularly does not substantially change the picture, but does show how much Reform UK’s support is concentrated among those in routine roles, as well as how much Labour’s is not.
Restore Britain also do best among those who’ve most recently worked in routine jobs, as well as among those who are long-term unemployed or have otherwise never worked. In both groups, the party holds a 6% vote share.
When it comes to full-time students, it is the Greens who are dominant, with 42% backing the environmentalist party, more than double the 18% who support Labour, the runner-up in this group.
How would Britain vote, two years since the 2024 election: by household income
A similar pattern is true when looking at household income, with Reform UK polling best among the lowest earners, taking 30% of the vote in households with an income of less than £30,000, relative to just 18% in homes earning in excess of £70,000.
By contrast, Labour’s vote today increases with household income, with 22% of those living in the highest-earning households backing the party, compared to just 15% in those earning less than £20,000. The Lib Dems likewise do best in the highest-earning households, while support for the Conservatives is reasonably consistent among all but the lowest income bands.
Excluding the lowest bracket, which disproportionately includes student households, Green voters are more likely to be found in higher earning households, taking 17% of the vote in those with incomes of £70,000 or more, compared to 13% in those with incomes between £20,000 and £30,000.
How would Britain vote, two years since the 2024 election: by housing tenure
Housing tenure is another area where traditional voting patterns have broken down.
Owning your home outright was once one of the strongest predictors of voting Conservative, and while it’s still one of the party’s best sources of support, just 25% of full homeowners back Kemi Badenoch’s party today, with a larger 31% opting for Reform UK instead.
Nigel Farage’s party take a similar 32% of the vote, as well as a clear lead, among those who rent from councils or housing associations. This was once a mainstay of Labour’s coalition, which is today not hugely differentiated between types of housing tenure: between 16-20% of voters in each of the five main housing categories support the party.
Green support is higher among those who live with family or friends (30%) or who rent from private landlords (26%), while falling to just 7% among those who own their home outright.
Mortgage holders are close to a five-way tie, with 20-22% supporting Reform UK, the Conservatives or Labour, and both the Greens (16%) and Lib Dems (14%) not far behind.
How would Britain vote, two years since the 2024 election: by social media usage
The impact of social media on politics has been a recurring concern in recent years, owing to the combination of its growing use as a source of news and the levels of disinformation on some platforms.
As most Britons use at least one social media platform, the voting profile of all social media users does not differ significantly from the public as a whole. Nonetheless, there are some differences between users of particular platforms.
The Greens, for instance, find notably higher levels of support among those who use Reddit (29%), Snapchat (26%) and TikTok (24%), partly reflecting the younger profile of these platforms’ users. Meanwhile, Restore Britain finds some of its highest levels of support (7%) among users of X (formerly known as Twitter), whose owner Elon Musk has endorsed the party.
Support for Reform UK is higher among users of Facebook (25%) and X (23%) and lower among those who visit LinkedIn (13%) and Reddit (12%), while likelihood to vote Labour is reasonably consistent across the major platforms, at between 18-23%.
Those who do not use social media are disproportionately likely to back Reform UK (35%) or the Conservatives (24%), mainly reflecting that this is a group that is predominantly older Britons.
How would Britain vote, two years since the 2024 election: by EU referendum vote
It might now be a decade since the EU referendum, but the legacy of the Brexit vote is still very apparent in today’s voting patterns, with only one party – the Conservatives – polling in double-digits among both Leavers (25%) and Remainers (17%).
They are not the top choice, though, among either group, with Reform UK taking nearly half of the vote (47%) among those who backed Brexit, while Labour lead among Remainers, on 27% of the vote, followed not too distantly by the Greens (20%) and the Lib Dems (19%).
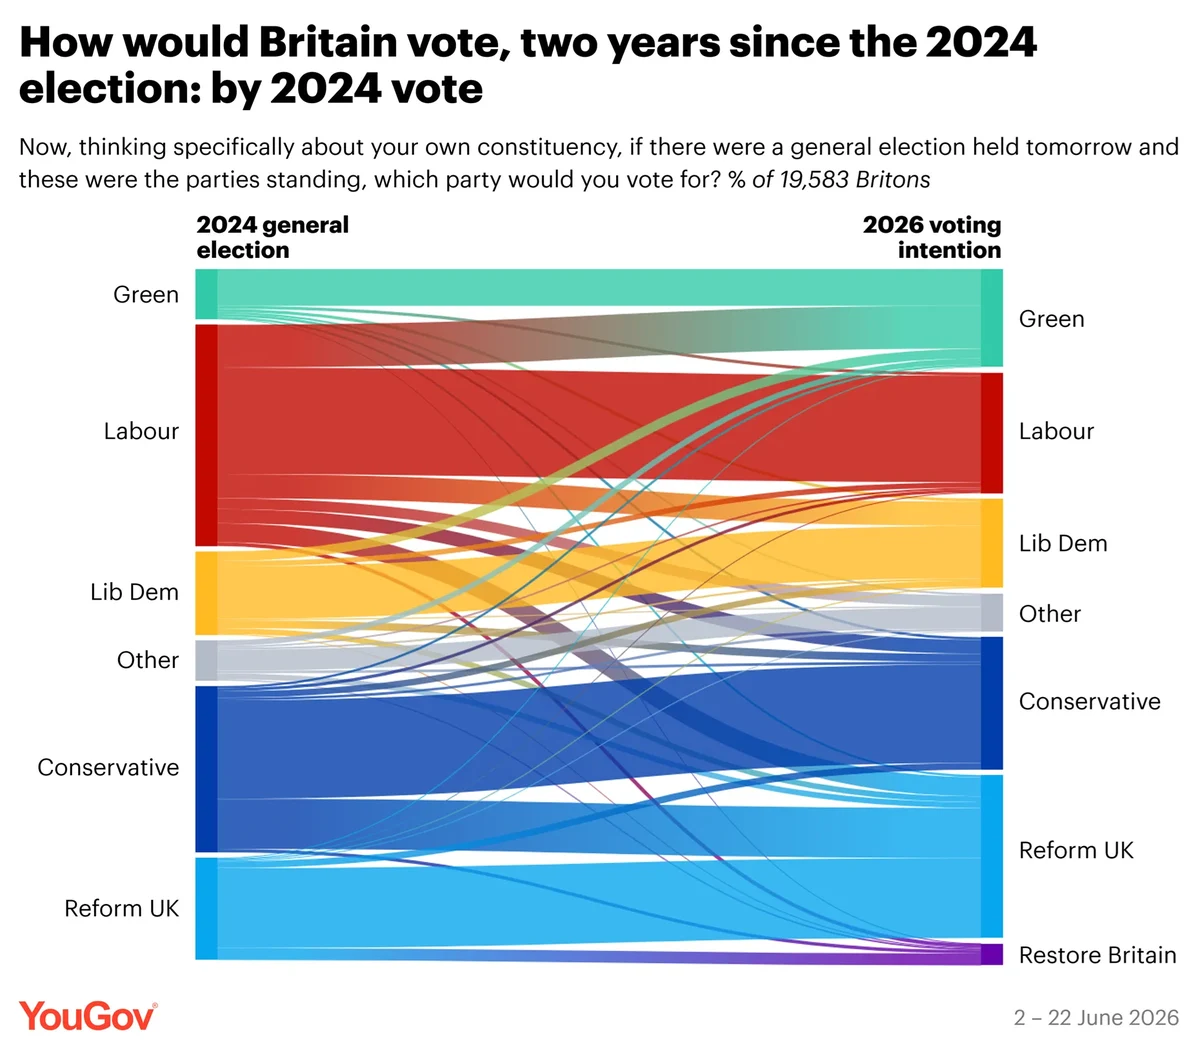
How would Britain vote, two years since the 2024 election: by 2024 vote
Two years on from their landslide victory, a mere 41% of those who voted for Labour stick with their choice, with 17% now backing the Greens, 9% favouring the Lib Dems and 6% switching to Reform UK, while 12% are unsure of their choice and 4% say they simply would not vote.
While the splintering of Labour’s coalition is particularly stark, they are not the only party that have struggled to retain their previous coalition. Just 50% of those who backed Rishi Sunak’s Tories currently support Kemi Badenoch’s Conservatives, with 26% instead favouring Reform UK and 10% not knowing who do vote for.
The Lib Dems have retained only a small majority of their 2024 voters (54%), with the Greens winning over 10%, the Conservatives taking 7%, and Labour and Reform UK gaining 5% each.
Reform UK have kept hold of a greater 70% of their 2024 voters, though with 10% now supporting Restore Britain and 6% now backing the Conservatives, while 67% of 2024 Green voters intend to vote for the party again, with their losses benefitting no one party in particular.
How has Labour’s support changed over Keir Starmer’s premiership?
One of Andy Burnham’s key challenges as prime minister will be reversing the decline in Labour support over Keir Starmer’s two-year premiership, a fall that has not been equal among all sections of the electorate.
Labour’s support has fallen more among the under 50s, including by as much as 24 points among those in their late 20s and 30s, compared to a 15 point reduction among those in their 50s, twelve points with those in their 60s, and just eight points among the over-70s. There has also been a greater decline in Labour’s vote share among Remainers (20 points) than Leavers (12 points).
However, Labour’s collapse has not always been ‘proportional’, i.e. greater where it had previously been strongest. For instance, among all three categories of education level, support has fallen by a similar 16 to 19 points.
Interested in taking YouGov surveys? Who would you vote for if a general election was held tomorrow? What do you think about British politics in general, and everything else? Have your say, join the YouGov panel, and get paid to share your thoughts. Sign up here.
Interested in commissioning YouGov research? We connect in real-time with real people around the world to gather their thoughts, behaviours, and opinions, to ensure that our research data is powered by reality. Explore our survey services here.
Photo: Getty