
Every month, YouGov identifies the brands generating the strongest surge in Word of Mouth scores in the United States.
Using data from YouGov BrandIndex, our daily brand tracking solution, we measure Word of Mouth, the percentage of people who say they have talked about a brand with friends or family in the past two weeks. The brands featured here recorded the largest increase in Word of Mouth in the latest month compared to the previous month.
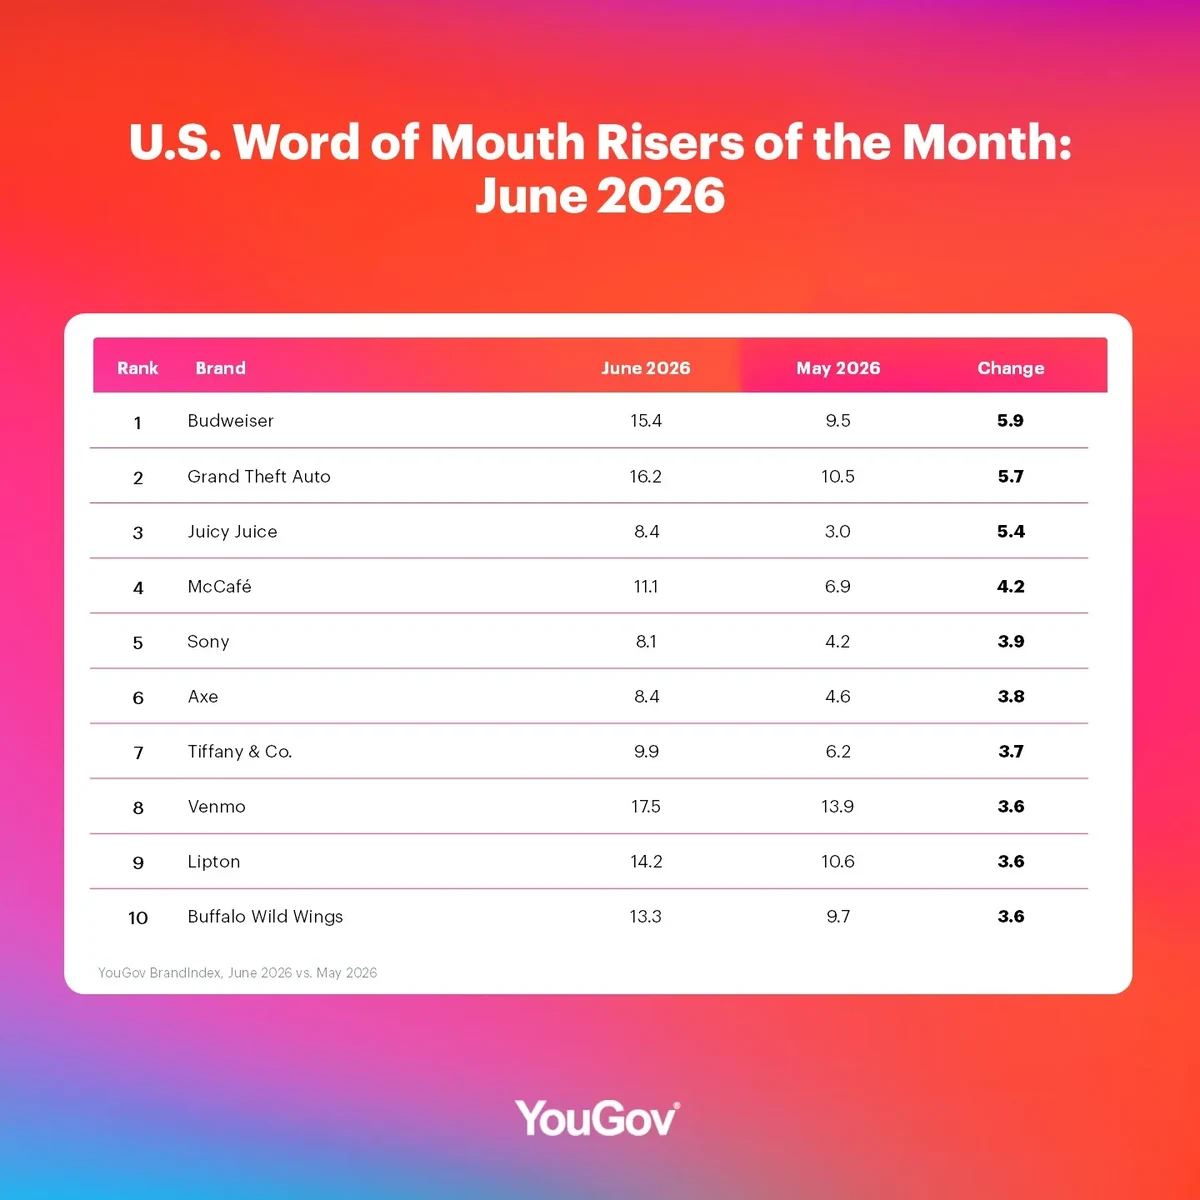
Word of Mouth Marketing: Brands with the strongest growth in June 2026
- Budweiser – 5.9 percentage-point increase (from 9.5% in May 2026 to 15.4% in June 2026)
- Grand Theft Auto – 5.7 percentage-point increase (from 10.5% in May 2026 to 16.2% in June 2026)
- Juicy Juice – 5.4 percentage-point increase (from 3.0% in May 2026 to 8.4% in June 2026)
- McCafé – 4.2 percentage-point increase (from 6.9% in May 2026 to 11.1% in June 2026)
- Sony – 3.9 percentage-point increase (from 4.2% in May 2026 to 8.1% in June 2026)
- Axe – 3.8 percentage-point increase (from 4.6% in May 2026 to 8.4% in June 2026)
- Tiffany & Co. – 3.7 percentage-point increase (from 6.2% in May 2026 to 9.9% in June 2026)
- Venmo – 3.6 percentage-point increase (from 13.9% in May 2026 to 17.5% in June 2026)
- Lipton – 3.6 percentage-point increase (from 10.6% in May 2026 to 14.2% in June 2026)
- Buffalo Wild Wings – 3.6 percentage-point increase (from 9.7% in May 2026 to 13.3% in June 2026)
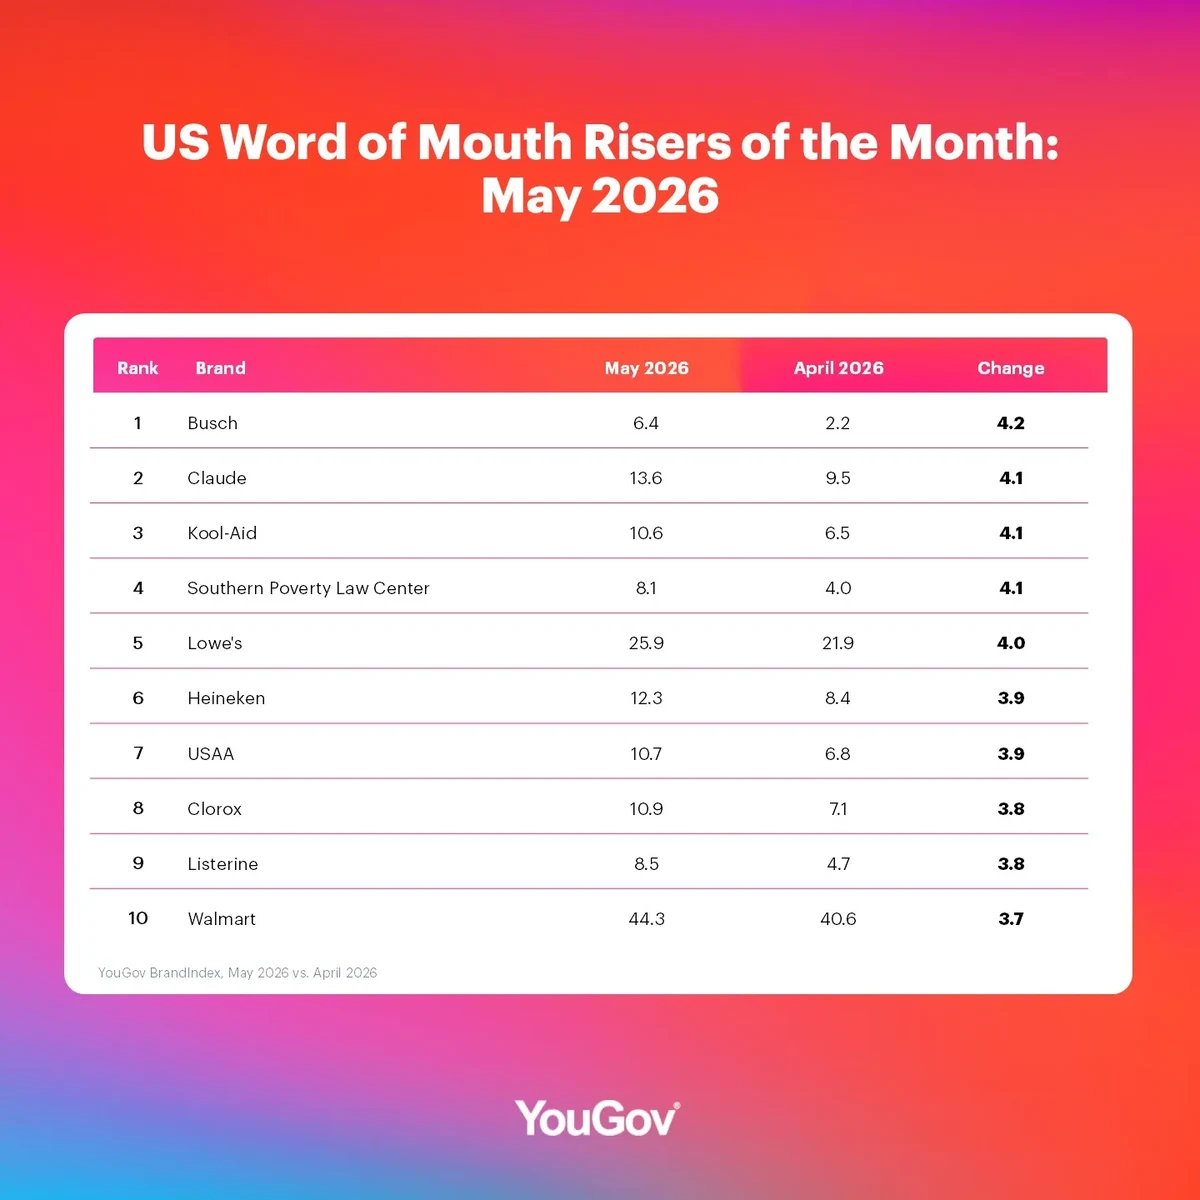
Word of Mouth Marketing: Brands with the strongest growth in May 2026
- Busch – 4.2 percentage-point increase (from 2.2% in April to 6.4% in May)
- Claude – 4.1 percentage-point increase (from 9.5% in April to 13.6% in May)
- Kool-Aid – 4.1 percentage-point increase (from 6.5% in April to 10.6% in May)
- Southern Poverty Law Center – 4.1 percentage-point increase (from 4.0% in April to 8.1% in May)
- Lowe's – 4.0 percentage-point increase (from 21.9% in April to 25.9% in May)
- Heineken – 3.9 percentage-point increase (from 8.4% in April to 12.3% in May)
- USAA – 3.9 percentage-point increase (from 6.8% in April to 10.7% in May)
- Clorox – 3.8 percentage-point increase (from 7.1% in April to 10.9% in May)
- Listerine – 3.8 percentage-point increase (from 4.7% in April to 8.5% in May)
- Walmart – 3.7 percentage-point increase (from 40.6% in April to 44.3% in May)
Methodology:
YouGov BrandIndex collects data on thousands of brands every day. Word of Mouth score is based on the question: “Which of the following brands have you talked about with friends or family in the past two weeks?"
Rankings in this article are based on change in Word of Mouth scores. To qualify as top improvers, a minimum base size of 300 (n) is required. In cases where the change in scores is the same between two brands, the current scores are used as a secondary metric to determine their ranking.
Brands tracked across multiple sectors are ranked based on their highest-performing sector. Both parent and child brands, such as Google and YouTube, are included to allow for greater granularity in performance tracking.