Spotify has had an eventful few weeks. On July 28, the streaming service began rolling out the latest instalment of its global Fan Life campaign, which celebrates the rituals and communities built around music fandom. The campaign features “Real-Life Superfans” and focuses on the live concert experience.
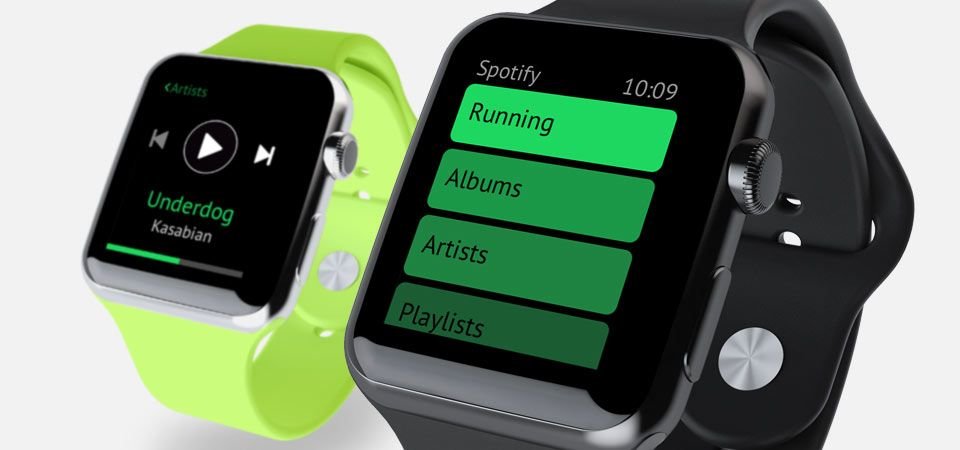
Two days later, Spotify announced Running Mode, a new personalized experience for Premium users that creates running sessions based on factors including workout type, duration, music preferences and beats per minute.
Against this backdrop, YouGov BrandIndex data shows Spotify recording notable improvements in both Ad Awareness and Purchase Intent.
Spotify’s Ad Awareness rebounds
Spotify’s Ad Awareness score – which tracks whether consumers have seen or heard an advertisement for a brand in the past two weeks – dipped slightly in mid-July before rebounding around the rollout of the Fan Life campaign.
The metric was relatively strong at the beginning of the month, reaching 25.5% on July 4, before declining slightly through mid-July to 20.8% on July 27, its lowest point during the period analyzed.
From there, Ad Awareness began to recover. The score rose to 21.4% on July 28, when the latest Fan Life campaign began rolling out, before jumping to 24.1% on July 31. The upward trend continued into August, with the metric peaking at 25.2% on August 5.
Ad Awareness remained around the 25% mark through August 9. This represents a 4.2-percentage-point increase from its July 27 low, effectively returning the metric to levels seen at the beginning of July.
Spotify Purchase Intent climbs above 21%
Spotify’s Purchase Intent score – which measures the percentage of consumers who would be most likely to visit the brand through desktop, laptop, tablet or mobile phone – followed a similar upward trajectory.
The metric reached 13.9% on July 22 before beginning to climb upwards. By July 28, as the latest Fan Life campaign started rolling out, Purchase Intent reached 16.8%. It rose further to 17.6% on July 30, when Spotify announced Running Mode.
The increase became more pronounced in early August. Purchase Intent reached 19.8% on August 4 and 21.0% the following day, before peaking at 21.2% on August 7.
By August 9, Purchase Intent had risen by 6.8 percentage points from its July 22 low-point, and by 3.9 points compared with July 28.
While BrandIndex data does not establish that Spotify’s recent campaign and product activity directly caused these increases, the timing shows that both Ad Awareness and Purchase Intent strengthened as the brand rolled out Fan Life and introduced Running Mode. Together, the shifts point to improving consumer visibility and consideration for Spotify during the period analyzed.
Methodology: YouGov BrandIndex collects data on thousands of brands every day. Spotify’s metric scores are based on these questions: “Which of the following online brands have you seen an advertisement for in the PAST TWO WEEKS?", "Which of the following online brands are you most likely to visit? (through desktop/laptop, tablet, or mobile phone)?”. Scores are reported as [net scores from –100 to +100 / percentages], based on daily surveys of US adults. Data is weighted using a propensity scoring methodology with targets from the American Community Survey (ACS) to ensure representation by age, gender, race, education, and region. Figures are shown as a [X]-week moving average with sample size ranging from 1,083 to1,200 between July 1 to August 9, 2026.
Image: Getty Images