
In 2024, Donald Trump won the popular vote by 1.5 percentage points, trailing the 2.6 point margin of Republican House candidates. Since then, it’s been downhill for Republicans, with Trump’s popularity falling into the mid-30s and popular dissatisfaction about inflation, tariffs, endless wars, ballrooms and monuments. Democrats have led in 2026 midterm polling for over a year, but recent polls (including our own) have shown double-digit leads and fueled talk of a blue wave.
One should be cautious in interpreting poll leads. The devil in election polling is in the details. Who is being polled? How do you decide who is a “likely voter”? And what do you do about undecided voters? These choices can have a substantial impact on who appears to be leading and by how much. This is the problem of researcher degrees of freedom. When there are many possible decisions about how to analyze the data, there is a corresponding range of estimates that is not reflected in the reported margin of error.
This is a serious problem for evaluating election polling in 2026. Democrats hold a significant lead in nearly every national House poll, but the size of the lead varies substantially depending on how you define registered voters, likely voters, and the undecided. We’ve noticed this in our own Economist/YouGov polls, with Democratic leads in the September 25-28 survey ranging from a fairly modest 6 points among current registrants to a hard-to-believe Democratic lead of 16 points with a particular likely voter screen. This is roughly the difference between a gentle swell and a tsunami.
In this note, we take a look at how different choices affect the size of the lead. There is no “right” definition of registered, likely, or undecided voters—all are, at best, reasonable approximations, subject to considerable uncertainty. Our goal here is to measure the impact of such choices and, along the way, obtain a better understanding of what is going on in the election. The TL;DR version is that there is a range of plausible Democratic margins—between about 8 and 14 points—that come from defensible data choices. The 16-point Democratic margin comes from a mix of assumptions that all push the result in Democrats’ favor and that should probably be discounted. This is still an uncomfortably wide range. (The Democratic margin was about 8 points in 2006 and 2018, but 14 points would be the largest margin since the post-Watergate election of 1974.) We will be releasing district-level results from our text-to-web polling before the election and, we hope, providing a narrower range.
Registered voters
Defining the registered voter universe seems easy. You need to be registered in order to vote, right? Except in North Dakota, which abolished voter registration in 1951 and allows anyone who shows up with a valid ID to vote if they attest to U.S. citizenship and having been a state resident for at least 30 days. And except in any of the remaining 49 states, where you can still register and vote in this election. They all allow registration up to 30 days before the election and in nearly half you can register as late as Election Day. Surely this is just a technicality? Nope. In past years, about 5% of people who vote registered after Labor Day. To deal with late registrations, we ask people if they are registered or whether they plan to register before the election.
Self-reports of registration, either current or future, are not entirely reliable. Some people think they are registered when they’re not. Others think they should be registered and avoid embarrassment by saying that they are. (This is known in the field as social desirability bias.) And, of course, many of those with the best of intentions of registering don’t do so. Everyone who conducts election surveys knows this is a problem. In some of our surveys, we try to match panelists to voter lists. In our text-to-web surveys, we select respondents from voter lists so we don’t need to rely upon their self-reports, though we miss those who register later.
Likely voters
But registration is far from the only problem. Who will actually vote? Our goal is to measure the margin among those who vote, not preferences of non-voters, but nobody (including the voters themselves) knows with certainty who will turn out. We hope that voters can tell us how likely they are to vote, but there’s not much benefit in asking this far in advance of an election. As the election nears, most pollsters think they can get better estimates by using a likely voter screen (or model). If you ask three pollsters, you will probably hear about four different methods they’ve used for determining who is a likely voter. There is no standard, agreed-upon procedure. We’ve tried lots of different approaches and are dissatisfied with all of them. For the YouGov/Economist poll, we use a single question (“How likely are you to vote in the election in November?”) and offer seven answers (already voted, definitely will vote, probably will vote, maybe will vote, probably will not vote, definitely will not vote, and don’t know).1 Our panelists, as is typical of most survey-takers, tend to be enthusiastic about voting and most say they have “already voted” or “definitely will vote.”
Using a likely voter screen or weighting by likelihood of voting only matters if high propensity voters' preferences are different from other registered voters'. Up until about a decade ago, the Republican margin in midterm polls was larger among likely voters than registered voters. For example, between 1994 and 2010, the Republican lead in Gallup polls was between 4 and 11 points larger among likely voters (using a model based on nine questions) than registered voters. Since 2016, high education/high turnout voters have become increasingly Democratic, leading to small differences in vote intent between registered and likely voters.
Until this year, that is. Throughout 2026, Democrats have held a lead among registered voters. At the beginning of the year, the Democratic lead was fairly small, but it has grown over time. The Democratic margin averaged 4 points in January and grew to 6 points in September. But likely voters are much more Democratic than those less likely to vote. Among currently registered voters who say they have already voted or will definitely vote, Democrats lead by 13 points, while Republicans lead among the remainder by 15 points. There are only 26 respondents in the September 25-28 survey who plan to register, and they are overwhelmingly Democratic (+45). Among the seven respondents who plan to register and say they will definitely vote, none say they are voting Republican.
The likely voter definition used in the last four YouGov/Economist polls defined likely voters as those who have already voted or say they will definitely vote. This would seem to be a “strict” likely voter screen, since it omits anyone who says they “probably” or “maybe” will vote. However, it includes some people who say they will definitely vote, but who aren’t yet registered, which is pretty loose.2 And the definition makes a big difference (for which, mea culpa): a Democratic lead of 16 points using this definition of likely voters. This is almost certainly an overstatement, since some of those who plan to register, won’t register or vote. Further, this effect is compounded by how the sample is weighted. (Those who plan to register are get upweighted because the weighting target is based on current registration.) Instead, we are introducing strict and loose likely voter screens into our crosstabs:
- Strict: Currently registered voters who have already voted or say they will definitely vote. This excludes anybody who plans to register or isn’t sure that they will vote.
- Loose: Adds currently registered voters who say they will probably vote, and people who plan to register and say they will definitely or probably vote. This balances uncertainty between the turnout and registration questions.
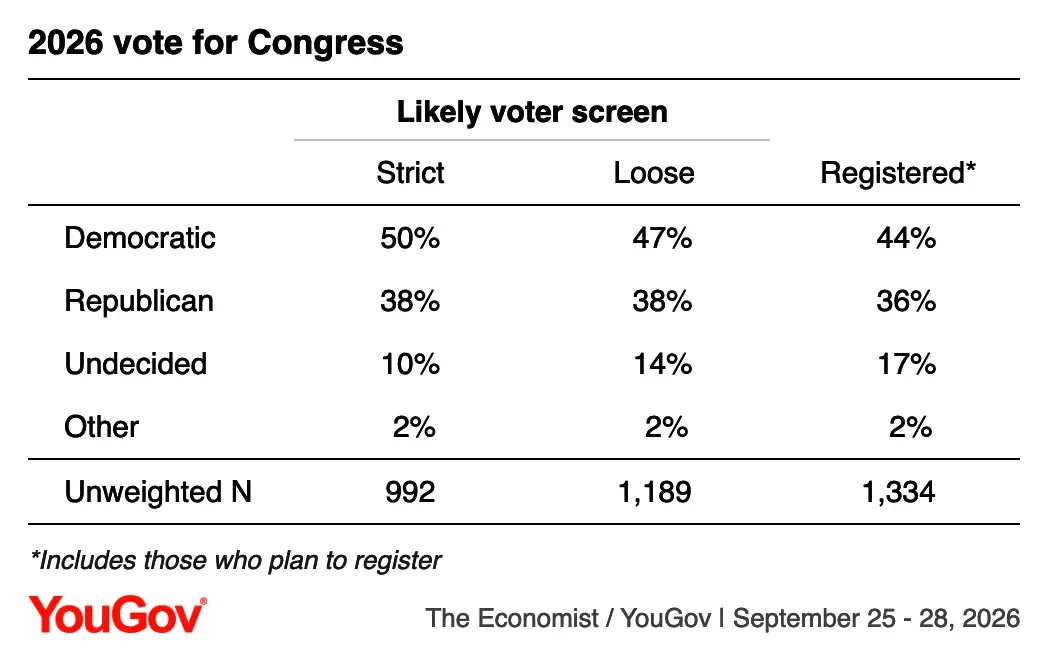
Table 1 below shows voting intention (without leaners) using each definition of the electorate. The Democratic margin is smallest (8 points) among all registered voters (including those planning to register; the lead is 6 points among currently registered voters). There is also an 9-point Democratic lead when the loose likely voter screen is applied. However, the Democratic margin grows to 12 points when the strict definition of likely voters is employed.
Table 1
Undecideds and switchers
There is yet another source of uncertainty that we haven’t covered yet: people who say they haven’t decided how to vote and those who say they have but might switch their votes over the next month. The impact of these groups is often exaggerated. In principle, all the currently undecided could vote for one party and substantially alter the outcome. In practice, many undecideds don’t vote and those who do also split their votes to some degree. We ask undecideds, “If you had to choose between these candidates, who would you be most likely to vote for?” One plausible rule is to combine leaners with those who express a voting intention and to ignore (or allocate proportionally) those who remain undecided after being pushed for a preference. There are many other possibilities for how to account for leaners, but usually the choice doesn’t matter much.
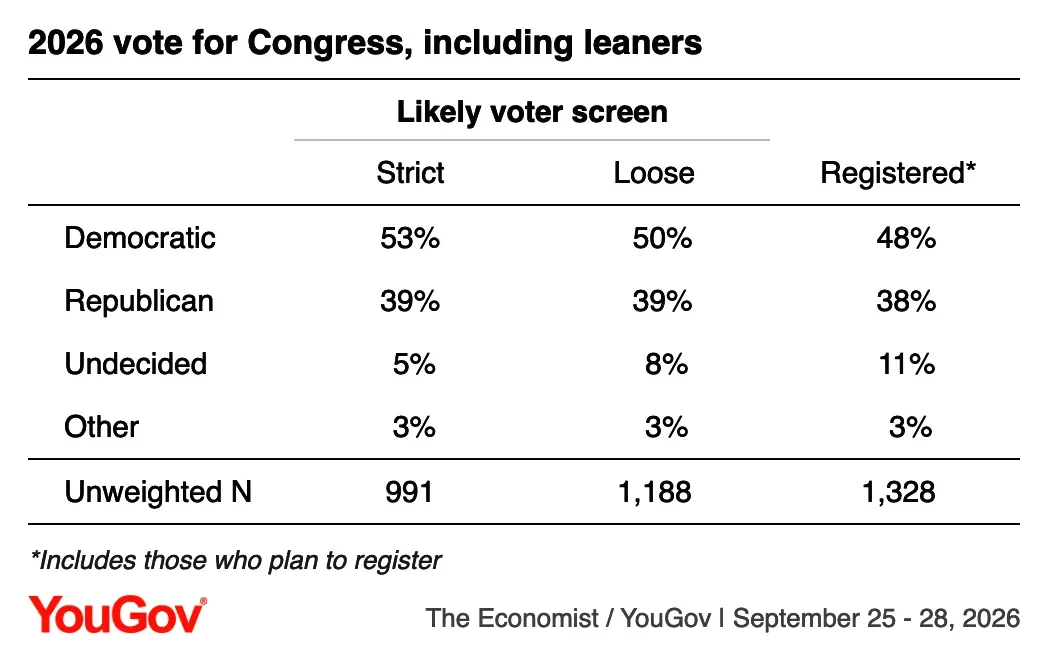
In Table 2, we combine those who lean toward each candidate with those who said they would vote for that candidate. Again, we use the same two definitions of likely voters, alongside registered voters. The Democratic lead with leaners included ranges from 9 points among all registered or planning to register, to 10 points with the loose turnout screen, to 14 points with the strict screen. This increases the Democratic margin, but 8's still smaller than the 16-point Democratic margin reported from this week’s poll, which includes people who are not yet registered but say they will definitely vote.
Table 2
This is quite a spread, but it doesn’t even include another potential source of uncertainty— switchers. Consumers of polls have undoubtedly heard that polls are only snapshots and not predictions—true, though also an all-purpose get-out-of-jail-free card for bad polling—but people can change their minds and we have tried to measure who might switch sides. For people who tell us how they are going to vote (but have not yet voted), we ask, “Would you consider voting for a different candidate, or is your mind made up?” This allows us to divide the electorate into five groups:
- Voters whose mind is made up. They tend to vote at high rates and don’t move much during a campaign.
- Voters who say they intend to vote for one of the candidates but would still consider a different candidate. These are shakier. They can be targets for persuasion and might not vote.
- Leaners who express a candidate preference when pushed.
- Undecideds who don’t lean toward either candidate.
- Nonvoters. These are only relevant when no likely voter screen is employed.
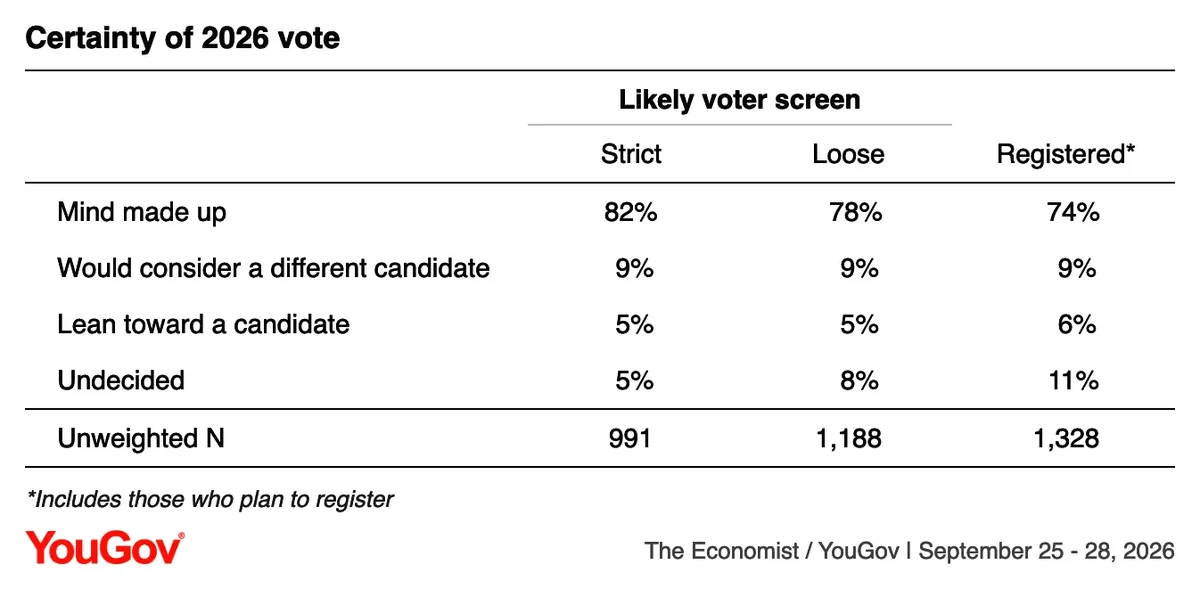
In Table 3, we display the proportions in each group using different definitions of likely voters. With the strict definition of likely voters, four out of five voters have made up their mind and there is limited opportunity for switching or persuasion. However, if you choose a looser likely voter screen (or none at all), there are more voters whose minds aren't made up and more undecideds—together, the malleable portion of the electorate.
Table 3
Does it matter?
Which likely voter screen is selected determines how much of the sample is open to persuasion or malleable. This only matters if the partisan composition of undecideds and potential switchers is different from those whose mind is made up. In many (perhaps most) years these groups don’t differ much in terms of past voting or current preference. In 2026, however, there is clear evidence that it matters a lot.
As shown in Table 4, Democrats have a substantial (11-point) margin among those whose mind is made up, but trail Republicans by 5 points among those who would consider a different candidate. This is actually bad news for Republicans, since it means that more voters who would consider a different candidate currently support the Republican House candidate. On the other hand, undecideds willing to express a preference are splitting heavily toward Democrats (57% to 38%). A Democratic tsunami depends upon getting these votes, which is not a sure thing.
Table 4
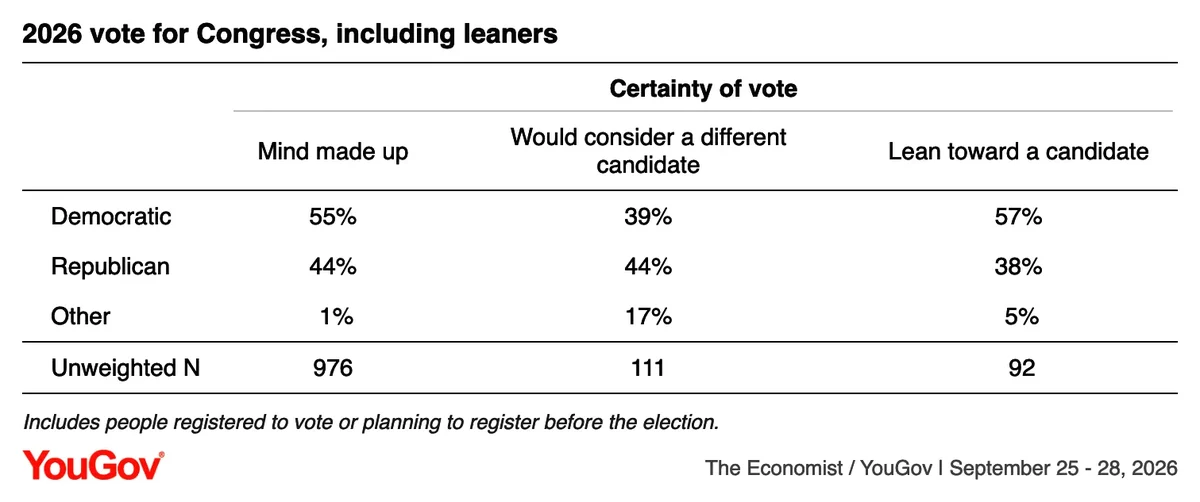
We can also compare these groups by how they voted in 2024. Those whose mind is made up voted for Harris 46%-43%. Those who are willing to consider voting for the opposing candidate voted for Trump 54%-21%, so there should be many more potential Republican votes in this group. Finally, those who are undecided voted for Trump 29%-22% (with 45% not voting in 2024). Republican hopes depend on defections among those currently intending to vote Democratic and persuasion and mobilization of those who are undecided.
If everyone stays put and the electorate is closer to the strict turnout scenario, this will be a blue tidal wave. Republicans won the 2024 House vote by nearly 3 points. If Democrats win the 2026 House vote by more than 10 points—many seemingly safe Republican seats will flip. On the other hand, if Republicans are able to recover some votes from those whose mind isn't made, are currently undecided, or not voting, we would expect the Democratic margin to shrink to around 8 points: still a blue wave but consistent with more modest Democratic gains in the House. One set of assumptions (a strict likely voter screen and pushing undecided voters) leads to the former, while another (a looser likely voter screen and different treatments of undecideds) leads to the latter. A Democratic wave seems very likely, but the size of that wave is much harder to predict.
Footnotes
- In our text-to-web polls, we use a model that we’ll describe another day. Models can use multiple variables and be calibrated to past data. But they are hard to explain.
- You can’t have already voted if not registered, even in North Dakota, which hasn’t opened early voting.
Image: Getty (Philip Thurston)