


This page collects state polls YouGov has conducted ahead of Election Day on November 3, 2026, with links to the full results for each. It also includes the results of YouGov's model estimating the outcome of the 2026 U.S. House elections.
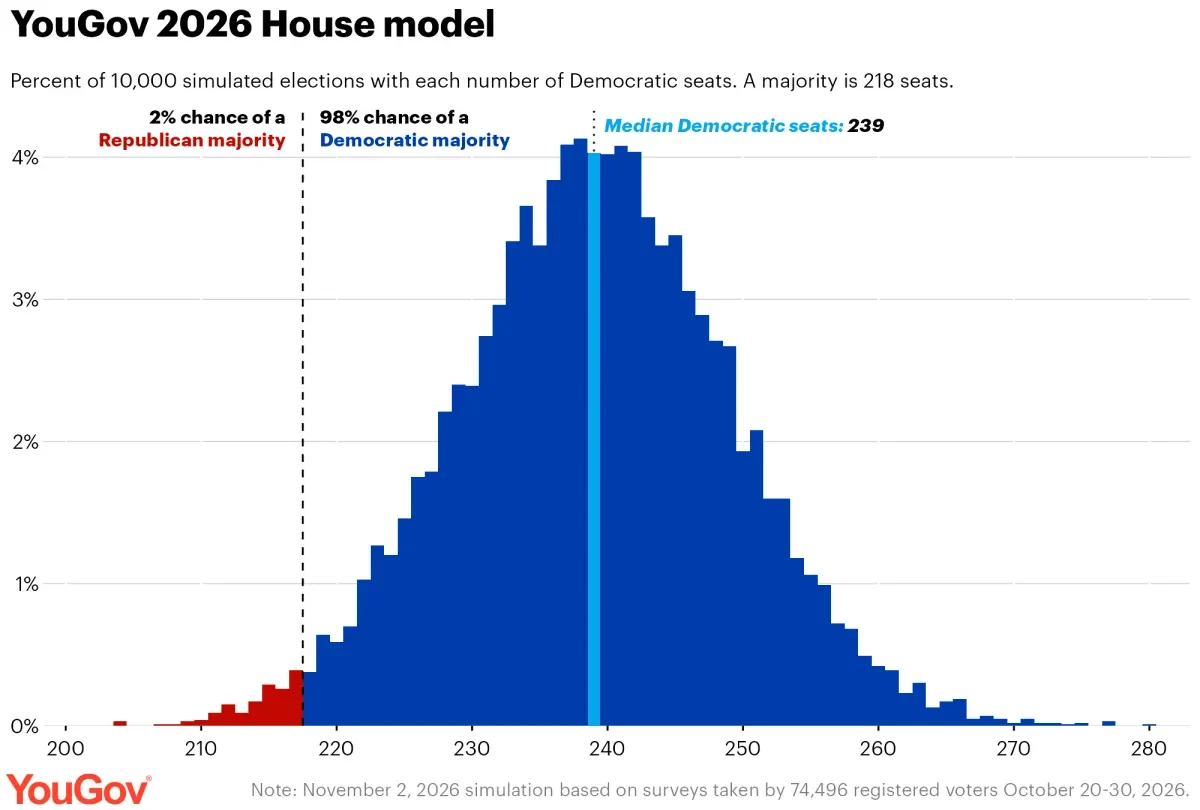
For its House estimates, YouGov simulated each of the House races 10,000 times. In 98% of those simulations, Democrats won a majority of seats — at least 218. In the median simulation, Democrats won 239 seats.
— Joe Williams and Brandon Bertelsen contributed to this article
Image: Getty (Finn Gomez / Staff)
Methodology
Senate and gubernatorial
Each state poll is conducted among a stratified random sample of voters selected from a list of that state's registered voters. Selected voters are contacted via text message and interviewed online on YouGov's web-based survey system; voters are selected at random within each stratum until the target number of interviews is completed. The sample is weighted to gender, age, in-state geography (using the current state voter list), party registration, and imputed education and 2024 presidential vote choice, with weights computed using the method of raking. Likely voters are defined using a model that takes into account past vote, demographics, and self-reported likelihood to vote. Respondents who are undecided are asked which candidate they lean toward, and their preference is allocated. Interviewing dates, the number of respondents, and the margin of error for each poll are given in its results document.
House
What method are you using to estimate votes?
Our approach to estimating the vote is based upon a multilevel regression with post-stratification (MRP) model. We have used this approach successfully in past elections in the U.S. — including in the 2024, 2020, 2018, and 2016 elections — and elsewhere. It uses a statistical model to predict how each registered voter in the U.S. will vote, whether or not they belong to YouGov’s panel. Interviews with our panelists are used to train a statistical model (called “multilevel regression”) that classifies people as likely to vote for a particular candidate (or to not vote) and then this model is applied to the entire voter file. We then aggregate these predictions — this is the “post-stratification” part — to estimate votes for all registered voters. The model has two stages: (i) estimate the likelihood of voting; and (ii) predict support for each candidate.
Who are you surveying?
The model is based on interviews with U.S. adults from a combination of data collected from YouGov panelists and text-to-web surveys of randomly selected registered voters. 3,915 interviews were conducted with YouGov panelists October 27–30, 2026. Text-to-web data collection is new to 2026. We sent text messages to randomly selected registered voters and invited them to take a short survey (containing a subset of the questions asked of YouGov panelists). 70,581 interviews were conducted with voters contacted by text message October 20–29, 2026.
What should people keep in mind when reading MRP-based estimates?
We caution that these models are based upon what people tell us they plan to do. A small share of registered voters say they are undecided, but the majority tell us their minds are made up. The estimates are subject to uncertainty and consistent with a range of outcomes. The simulation reflects our best assessment of the uncertainty associated with the number of seats each party is likely to win.
What outside data are you using to improve accuracy?
We rely heavily upon information from state voter files and election returns. Voter files provide demographic information about registered voters and their “vote history” (which past elections they have voted in, but not whom they voted for). We use precinct-level election returns to help us model past vote choices so that our samples reflect the correct proportions of Democratic and Republican voters in past elections. After each election, we update these datasets.
Why is it important to use statistical modeling to supplement interviews?
The samples in many districts are small and often, to some degree, unrepresentative of the universe of registered voters. We have used statistical models to correct for skews in sample demographics and other characteristics (like party registration, past vote, and turnout).
Who made the model?
The model has been designed and tested by members of the YouGov political team in the U.S., headed by Doug Rivers and Delia Bailey. MRP is an invention of Andrew Gelman, who is known around our offices as Mister P.
Related content
- See results for the October 27–30, 2026 YouGov national pre-election study of 3,915 likely voters
- 2026 congressional elections topic page
- What Americans think about Congress
- Congressional ballot voting intention tracker
Prior state polling
- Iowa | Likely voters | October 6-12, 2026
- Florida | Likely voters | September 28 - October 5, 2026
- New Hampshire | Likely voters | September 28 - October 5, 2026
- Texas | Likely voters | September 28 - October 5, 2026
- Kansas | Likely voters | September 24 - October 4, 2026
- Michigan | Likely voters | September 22 - October 4, 2026
- Nebraska | Likely voters | September 24 - October 3, 2026
- Ohio | Likely voters | September 18-30, 2026
- Georgia | Registered voters | September 15-18, 2026
- North Carolina | Registered voters | September 15-18, 2026
- Iowa | Registered voters | September 3-8, 2026
- Maine | Registered voters | September 2-8, 2026
What do you really think about President Trump, American politics in general, and everything else? Share your reality, join the YouGov panel, and get paid to share your thoughts. Sign up here.