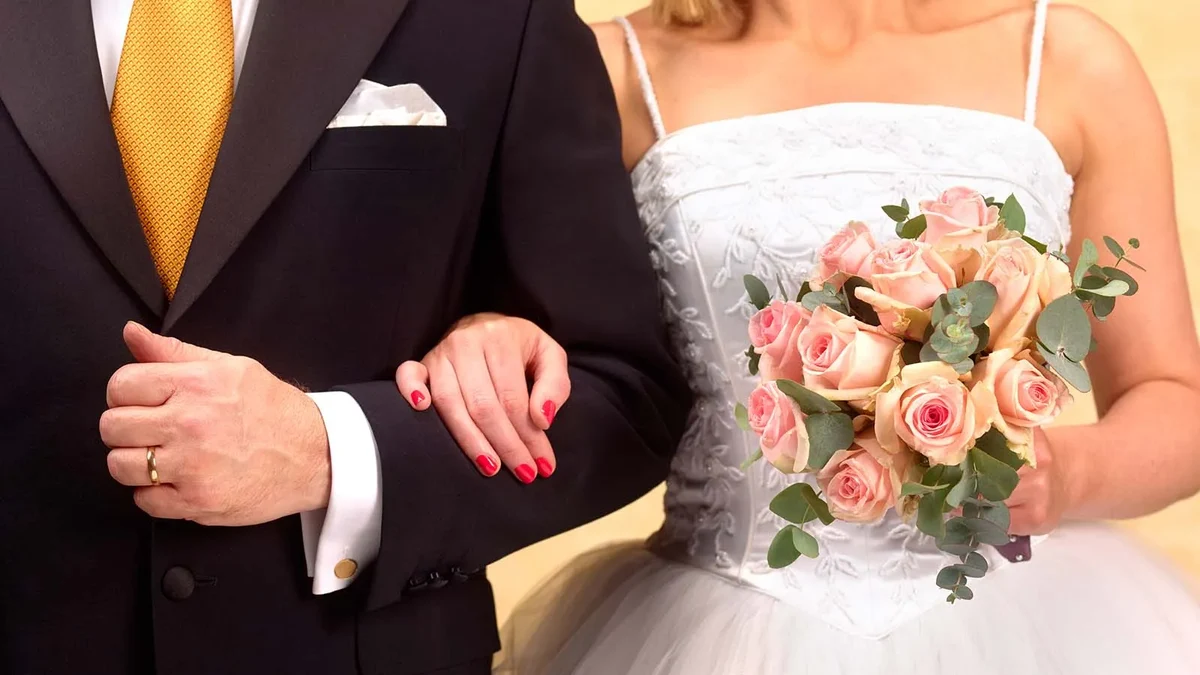
Beyond what the public want to see at a wedding, how would Britons plan their big day? The next chapter of our Big Survey looks at the choices those who either would like to get married or who are already married would make on the key wedding day decisions if they were about to tie the knot.
What time of year would Britons get married?
When to get married is one of the first decisions that engaged couples have to make, otherwise, how can guests ‘save the date’ or venues be booked?
The most attractive seasons to get married are spring and summer, each of which would be the choice for around a third of those open to getting married (31-32%). Autumn also has a fair few fans, with one in five (20%) saying autumnal nuptials would be their preference, while just 6% would opt for a winter wedding.
What wedding venue would Britons choose?
Where to get married is the next big question, with there now an array of options for potential couples to pick from, ranging from the traditional church wedding to the more relaxed beach wedding.
Churches (or other religious buildings) and country houses are the top choices, each being the preferred choice of 20%, while a registry office would be the first choice for 17%.
A hotel would be the venue of choice for 10%, while 9% would favour a beach wedding, if they had the option. A marquee or outdoor wedding would the choice of 7%, with 8% having some other type of venue in mind.
There is a generational gap when it comes to venue choice. A church or registry office are each the top choice for a quarter of over 55s who are married or open to getting married (25-26%), while just 15% of similarly minded 18-34 year olds would want a church wedding and a mere 6% say they would lean towards tying the knot in a registry office.
By contrast, the younger generation are more likely to favour getting married in a country house (24% vs 16%), at the beach (12% vs 6%) or in a marquee (11% vs 4%).
What size of wedding would Britons want?
Of course, the choice of venue will largely reflect the size of the desired wedding, and here, a smaller wedding, attended only by the couple’s closest friends and family, is the preference for 62% of marriage-positive Britons.
By contrast, 22% favour a larger wedding, featuring lots of people from the couple’s lives, while 12% want a more private ceremony, with just the couple and witnesses exchanging bands at a registry office.
What choices would Britons make for their wedding?
Jointly cutting the wedding cake with your new spouse is one of the most appealing wedding customs for those open to getting married, with 85% saying they would choose to do so at their wedding. What that cake consists of, however, is more divisive, with just 42% saying they would have a traditional tiered fruitcake, falling to just 25% among those under 35.
Taking the first dance with your spouse alone and hiring a wedding photographer are also easy choices for many, with 74% saying they would include these in their wedding plans. Six in ten (60%) would also have guests throw confetti at them after the ceremony, if they were getting married tomorrow.
Stag and hen dos aren’t for everyone. Indeed, just half of those open to marriage (51%) would opt to have one, though this rises to 64% among those aged 18-34. Writing your own wedding vows has a similar appeal, with nearly half (47%) saying they would opt to do so, again rising to 64% among the younger generation.
Hiring someone to film the wedding and creating a registry are less appealing practices, with just 36% saying they would go down these paths, while around half (48-52%) say they would not.
Only a third (33%) say they would want to have a religious wedding ceremony, while approaching six in ten (57%) would not want to unite in holy matrimony.
Choices where grooms- and brides-to-be are least likely to say “I do” include having a destination or themed wedding, which respectively appeal to just 22% and 14% of those open to marriage, or hiring a wedding planner, which is of interest to a just one in seven (15%), though rising to 29% among the under 35s.
Rehearsing their big day also has limited appeal, with just 27% saying they would want to rehearse the ceremony and a mere 12% wanting to do a run through of the dinner.
Six in ten women who are married or open to being married (59%) say they would want to be given away if they were getting married tomorrow, though a third (32%) say they would not to follow the tradition that has sometimes been criticised as patriarchal.
What would Britons wear on their wedding day?
While wedding attire can sometimes be a tricky choice for guests, for the happy couple, there are some more established traditions that can be fallen back on.
Married and willing-to-be married women are mostly sticklers for these traditions, with 59% saying they’d choose to wear a white wedding dress on their big day, though 25% would want a wedding dress in another colour. Only 8% would opt for something other than a dress.
By contrast, their male counterparts are less keen on traditional wedding garb, with just 14% saying they’d wear morning dress (including top hat and tails) on their wedding day, relative to two thirds (65%) instead preferring a more modern suit. A further 13% say they’d rather wear something else entirely.
What music would Britons play at their wedding?
One aspect of a wedding that does appear to be falling out of fashion is the traditional wedding march, with just 24% of those open to marriage saying they’d like their partner to walk down the aisle to a piece such as Wagner’s ‘Bridal Chorus’, or ‘Here Comes the Bride’ as it is more commonly known.
A similar proportion (25%) would instead opt for a different piece of music played on an organ or on string instruments, perhaps like Pachelbel’s Cannon, while roughly a further quarter (27%) would favour some other kind of music entirely.
As for the music at the reception, potential wedding-havers tend to favour a DJ over a live band by a margin of 40% to 29%.
Would Britons splash the cash on their dream wedding?
Ultimately, the costs of these wedding desires are likely to stack up, bringing couples to the difficult question of whether it’s better to go all out and pay lots of money to have their dream wedding, or to try and keep costs down with a more restrained affair.
Britons open to getting married overwhelmingly err towards the latter, with 81% saying they would look to keep things within some kind of budget, relative to just 12% being willing to splash the cash on their dream wedding.
Younger people are a little more willing to push the boat out, however, with 22% of 18-34 year olds who are willing to wed being open to making it rain, relative to 5% of such over 55s.
Interested in taking YouGov surveys? How would you plan your wedding? What do you think about weddings in general, and everything else? Have your say, join the YouGov panel, and get paid to share your thoughts. Sign up here.
Interested in commissioning YouGov research? We connect in real-time with real people around the world to gather their thoughts, behaviours, and opinions, to ensure that our research data is powered by reality. Explore our survey services here.
Photo: Getty