
A YouGov experiment finds that applicants’ legal status and personal circumstances make the most difference to the public’s decision
In August, Reform UK deputy leader Richard Tice announced plans to give priority in social housing allocations to British-born workers under 35, alongside former military personnel and married couples with children.
The government itself is currently reviewing the qualification rules for social housing, with a call for evidence on the subject having ended last month.
Now a new YouGov experiment explores who the public does and does not prioritise for social housing.
Our experiment showed respondents two separate profiles of applicants for social housing, and asked people to pick which one of the pair they would prioritise. Each profile contained seven categories of information about the applicant, with the attribute for each category randomly selected from a base list each time.
These categories and attributes were as follows:
- Applicant’s age
- 25 years old
- 35 years old
- 45 years old
- 55 years old
- 65 years old
- 75 years old
- Applicant’s gender
- Male
- Female
- Applicant’s employment status
- Key worker
- Working full-time
- Working part-time
- Retired
- Not working
- The composition of the applicant’s household
- Household with dependent
- Family carer
- Couple
- Single adult
- The applicant’s legal status
- UK citizen
- Non-UK citizen with permission to live in UK permanently and has children who are UK citizens
- Non-UK citizen with permission to live in UK permanently
- Granted refugee status
- How long the applicant had lived in the local area or whether they had a local connection
- Lived in the area for 5 years+
- Lived in area for 3-5 years
- Lived in area for 1-3 years
- Lived in area for less than 1 year
- No local connection but does have family in the area
- No local connection
- The applicant’s personal circumstances dictating their level of need
- Fleeing domestic violence
- Urgent medical need or disability requiring suitable housing
- Sleeping rough
- Homeless and living in emergency housing
- Armed forces veteran
- At risk of homelessness
- Care leaver
- Living in overcrowding
- Living with family
No attribute could be duplicated between the two profiles, i.e. it could not be the case that both applicants were female, or both could be sleeping rough.
Below is an example of how this would have looked to respondents taking the survey.
Respondents were asked to perform this exercise three times. Overall, each individual attribute was seen an average 10,008 times across a sample of 8,578 respondents.
The results that follow show how often an applicant with a given attribute was picked for priority from the times where that randomly selected attribute was displayed. So for instance, where we show a score of 53% for someone whose profile says they are a full-time worker, we mean that 53% of the time a profile was generated that included that attribute, they were the one from the pair of profiles the respondent picked to give social housing priority.
Because respondents were choosing between one of two profiles each time they were asked to pick, this means that if an attribute scores higher than 50%, they were picked for priority more often than they were not picked for priority. Likewise, an attribute that scores less than 50% was picked for priority less often than they were not picked. If the score is about 50%, then someone with this attribute was picked about half the times they were shown.
To put it another way, a score close to 50% means that, on average, having that attribute neither helped nor hurt an applicant’s chances compared with the other options in the same category. The further a score is from 50% the more that attribute tended to influence respondents towards picking the applicant (scores above 50%) or away from picking them (scores below 50%).
It should be noted that scores below 50% do not necessarily represent opposition to people with that attribute receiving social housing, merely that they are not seen as the highest priority.
How does an applicant’s age affect how often they are prioritised for social housing?
The older the social housing applicant, the more likely they are to be picked for social housing priority.
When the randomised profile showed an applicant who was 25 years old, that profile was picked for priority 46% of the time. This compares to 48% for 35 and 45 year olds, 50% for 55 year olds, 54% for 65 year olds and 55% for 75 year olds.
How does an applicant’s gender affect how often they are prioritised for social housing?
Female applicants are more likely to be picked than men, at 53% of the time versus 47%.
How does an applicant’s employment status affect how often they are prioritised for social housing?
Unsurprisingly, applicants who are not working are the least likely to be picked, being chosen only 41% of the time. Retired applicants also tend to be picked less often than not (46%).
Profiles for someone who is in work part-time are picked 51% of the times they are present, while for a full-time worker profile this figure is 53%. Key workers are noticeably more likely to be picked than other groups (59%).
How does an applicant’s household composition affect how often they are prioritised for social housing?
Profiles for single adults (44%) and couples (47%) are the least likely to be picked, while family carers are picked 54% of the time and households with dependents 56% of the time.
How does an applicant’s legal status affect how often they are prioritised for social housing?
In the paired match-ups, profiles for someone who is a UK citizen are picked 68% of the time – this is the highest figure for any single variable across the entire study. Non-citizens with UK citizen children are picked 51% of the time, a figure which falls to 44% for such non-citizens without children. Those who had only been granted refugee status are picked in 38% of cases.
How does an applicant’s local area connection affect how often they are prioritised for social housing?
Unsurprisingly, the stronger someone’s connection with the local community, the more likely their application was to be picked. Those whose profile says they have lived in the area for longer than five years, or for 3-5 years, are picked 55% of the time. Living in the area for 1-3 years sees an applicant picked 52% of the time.
Applicants are about equally (un)likely to be picked if they have lived in the area for less than a year or have no local connection but do have family in the area, both on 47%. Those with no local connection at all are only picked 44% of the time.
How do an applicant’s personal circumstances affect how often they are prioritised for social housing?
We included a range of nine personal circumstances in the applications. Most likely to see an applicant picked are “fleeing domestic violence” and “urgent medical need or disability requiring suitable housing”, both at 60%, as well as “sleeping rough” on 59%.
Applicants who are “homeless and living in emergency housing” were also more likely to be picked than not when they appeared, at 56%, while armed forces veterans were picked 52% of the time.
Applicants described simply as “at risk of homelessness” were picked in 50% of cases.
In terms of personal circumstances that are relatively less likely to get someone selected for social housing priority, “care leavers” are only picked 42% of the time, while people “living in overcrowding” are chosen just 40% of the time. For those simply described as “living with family” (effectively our baseline personal circumstance representing someone who doesn’t have pressing needs) the figure is just 32% - this represents the lowest figure for any individual variable across the whole experiment.
Refugees in the greatest need are not prioritised more often than UK citizens of any need level
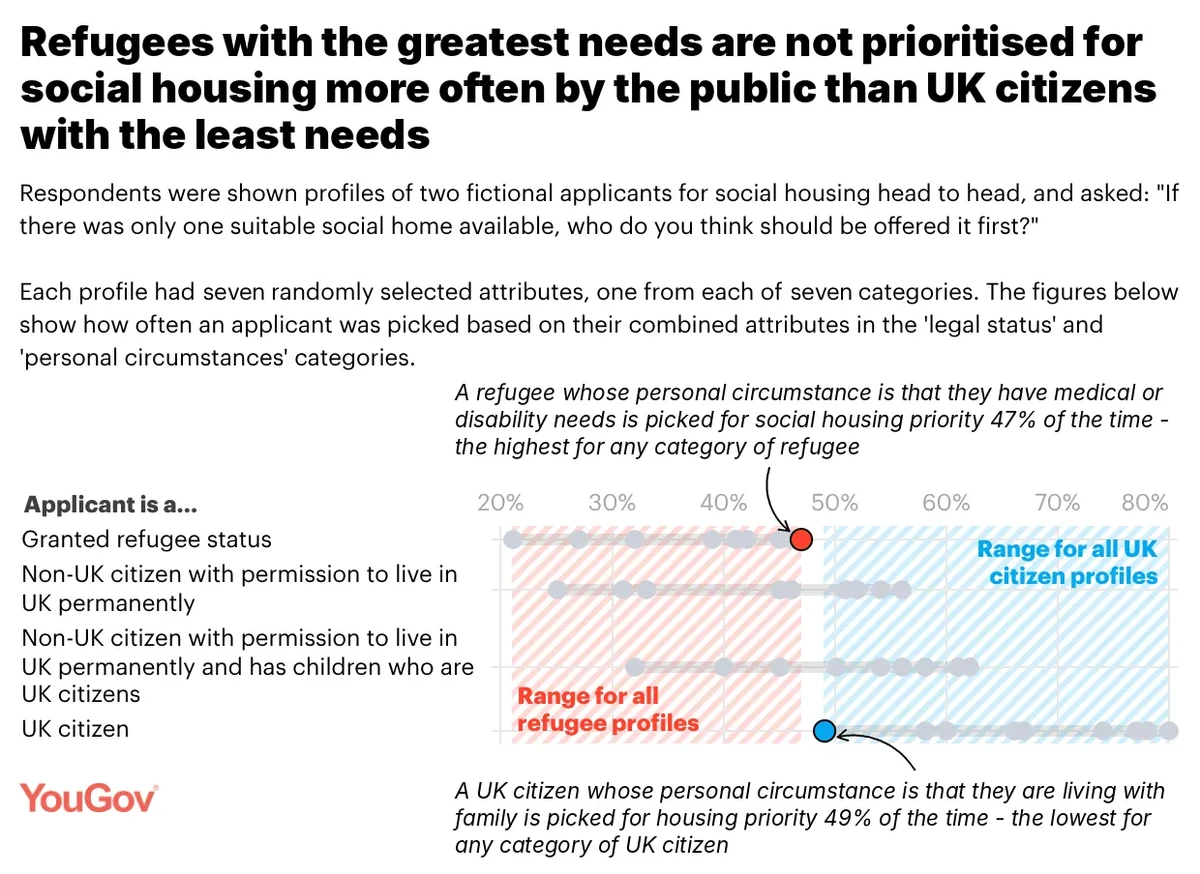
With legal status and personal circumstances the two categories that had the most influence on prioritisation, an examination of the two together shows that the refugee penalty is so strong that those refugees with the biggest needs are not seen as higher priority than UK citizens who face much less serious circumstances. A refugee with an urgent medical need is picked 47% of the time, compared with 49% for a UK citizen whose only circumstance is living with family.
By contrast, UK citizens who are fleeing domestic violence are the single most prioritised combination of two variables across the whole experiment, with such an applicant being prioritised 80% of the times they appeared.
Likewise, a refugee whose personal circumstance is that they are living with family is the least likely combination to be prioritised, at only 21%.
Looking at other combinations of results shows that gender appears to matter no more when it comes to cases of domestic violence than it does in general across all characteristics. While women are 6pts more likely to be prioritised for social housing than men in general (53% vs 47%), this gap remains effectively the same for women who are fleeing domestic violence (64%) compared to men fleeing domestic violence (57%).
More broadly, examining applicant prioritisation rates across combinations of two attributes largely shows trends you would expect based on the rate at which the individual attributes are prioritised. The only area to show much of a deviation from this trend is not particularly surprising, with people categorised as “not working” less likely to be penalised if they are 65 or 75 years old (presumably as respondents are treating them as retired). Likewise, 25, 35 and 45 year olds whose profiles say they are retired are also penalised more heavily than those of an age where that is a more realistic employment status.
How do attitudes differ by 2024 vote?
As with the wider public, some attributes, like age and gender, appear to make relatively little difference to voters’ decision to prioritise someone for social housing.
However, for the two categories that made the most difference for the public as a whole, there are wide splits between voters. Specifically, there appears to be a left-right divide, with Conservative and Reform voters’ decisions varying more based on an applicant’s legal status, while Labour, Lib Dem and Green voters’ choices seem more dependent on the applicant’s personal circumstances.
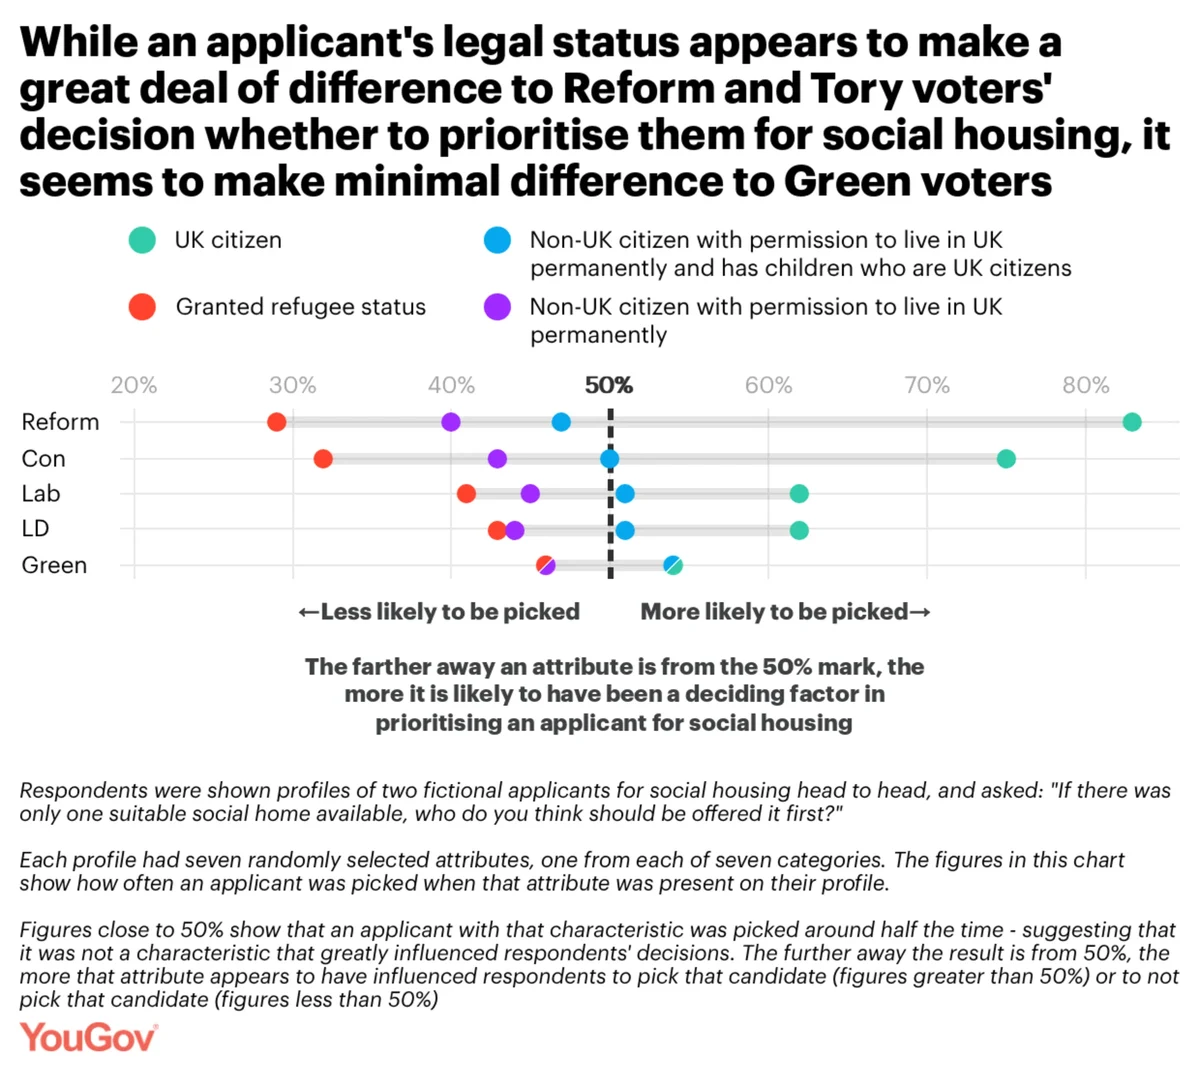
When it comes to legal status, the prioritisation rate for Reform UK voters varied by fully 54pts, from a low of 29% for a refugee to a high of 83% for a UK citizen. Likewise, for Conservative voters, a refugee applicant was picked 32% of the time their profile appeared, while a UK citizen was granted priority 75% of the time – a range of 43pts.
For Labour and Lib Dem voters the range between top and bottom was a much lower 19-21pts, and for Greens was a mere 8pts.
In fact, Greens are as likely to have chosen an applicant who is a non-citizen with permanent residency and has children who are UK citizens as they are to have chosen UK citizens themselves, at 54% in both cases. This compares to 46% when the applicant is a non-UK citizen with permanent residency (but no mention of children) and the same number for those granted refugee status, both groups being picked 46% of the time they came up by Greens. The fact that all of these figures are so close to the 50% mark suggests that legal status has relatively little influence on Greens’ decision making.
By contrast, Greens appear far more likely to be influenced by applicants’ personal circumstances. There is a 47pt gap between the attribute Green voters are least likely to prioritise for social housing when it appears (living with family, at 23%) and the ones they are most likely to prioritise (fleeing domestic violence, or someone with urgent medical need or disability requiring suitable housing, both on 70%).
For Labour and Lib Dem voters, an applicant’s personal circumstances are likewise the factor that seems to influence decisions the most, with gaps of 36-38pts between the least and most likely applicants to be prioritised. As with the Greens, in both cases someone who is living with family is least likely to be prioritised (26-28%) and someone who is fleeing domestic violence is the most likely (64% for both voting groups).
By contrast, Tory and Reform UK voters’ decisions differ less on this category, with ranges of 26pts and 22pts respectively from top to bottom variable.
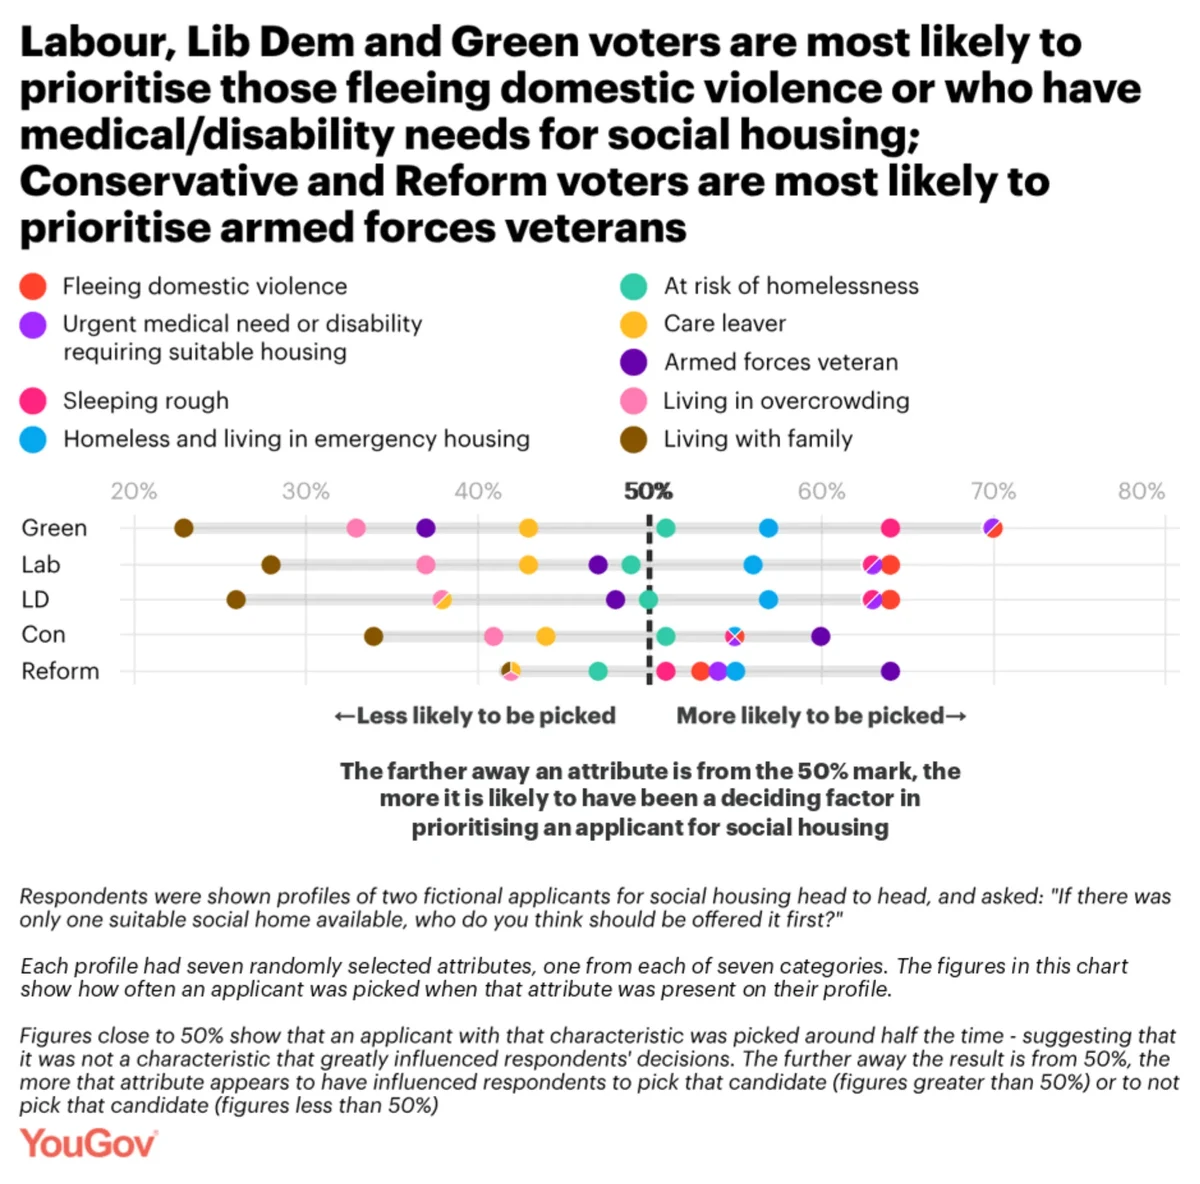
As with their left-wing voting counterparts, both groups are least likely to have prioritised someone who is living with family, at 34% for Tories and 42% for Reform UK voters (although in the case of Reform voters this figure is tied with people living in overcrowded circumstances and care leavers).
Unlike Labour, Lib Dem and Green voters, however, the personal circumstance that Conservative and Reform voters are most likely to favour for prioritisation is being an armed forces veteran. Reform voters picked an applicant with this attribute 64% of the time they appeared, with 60% of Tories doing the same.
See the full results:
Methodology
- Sample size: An online survey of 8,578 adults aged 18+ living in Britain
- Fieldwork: 30 September - 14 October 2026
- Commissioned by: YouGov
Click here for more information about how we carry out research
Interested in taking YouGov surveys? What do you think about prioritising social housing, the benefits system in general, and everything else? Have your say, join the YouGov panel, and get paid to share your thoughts. Sign up here.
Interested in commissioning YouGov research? We connect in real-time with real people around the world to gather their thoughts, behaviours, and opinions, to ensure that our research data is powered by reality. Explore our survey services here.
Photo: Getty